Hi eazyBI Community,
I would like to create a report that shows an idea (entered into the Jira Backlog “To Do”) to start of execution (in progress) and time of start of execution to first value (Done). Any recommendations would be great. Thanks
Hi eazyBI Community,
I would like to create a report that shows an idea (entered into the Jira Backlog “To Do”) to start of execution (in progress) and time of start of execution to first value (Done). Any recommendations would be great. Thanks
Hello @NickSocci ,
Thanks for posting your question!
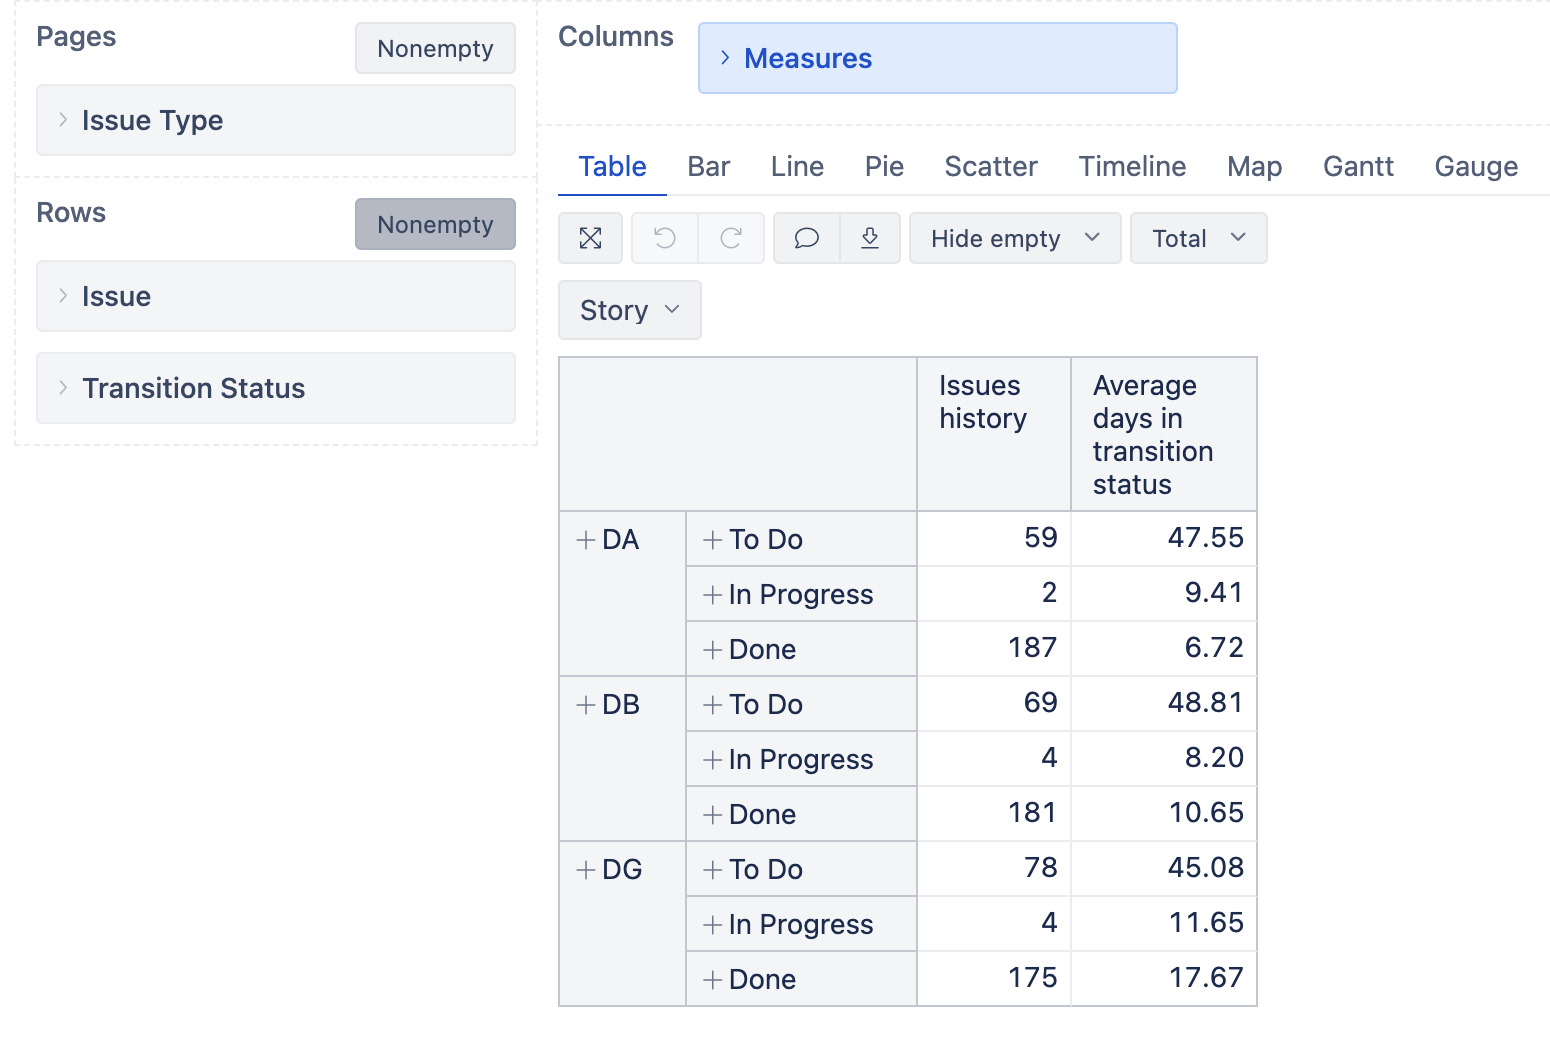
As a start, I suggest that you create a report following these steps:
add Issue and Transition status Dimension in Rows. Choose hierarchy: “Category” for the Transition Status
add “Average days in status” under Measures dimension
add Issue Type in Pages to filter by “Idea” (in my example below, I am filtering by Stories)
It should give you similar report to the one displayed below:
Is this what you were looking for, or is there a more specific requirement?
Best,
Marita // support@eazybi.com
Hi Marita … Thanks for your reply. Is there a way to combine the In Progress and Done Categories to calculate an average days of transition? The outcome is to see how long (on average) is an issue taken in to be worked on (In Progress) to completion (Done). Thanks again.
Hello @NickSocci ,
You can achieve this by moving Transition status to Pages and choosing “All Transition Statuses by category”.
You can then select the status “In Progress” and “Done” from the dropdown menu, and it will return the sum of issues in both statuses as well as the average time spent in these statuses.
You can read more on filtering in Pages here: Create reports
![]()
Let me know if this works for you.
Best,
Marita // support@eazybi.com
I am looking to create a calculation of the average number of days that an issue is in the
To Do Status Category which includes the status - Blocked, Open, In Refinement and To Do. This would represent average days sitting on the backlog prior to development starting. The other metric I would like to calculate is the average days development takes to complete the item. This would include all status in the In Progress and Done Status Category In Development, In Peer Review , Ready to Test , In Testing, In Acceptance and Done.
| Blocked | To Do | . |
|---|---|---|
| Open | To Do | |
| In Refinement | To Do | |
| To Do | To Do | |
| In Development | In Progress | |
| In Peer Review | In Progress | . |
| Ready to Test | In Progress | |
| In Testing | In Progress | . |
| In Acceptance | In Progress | |
| Done | Done | |
| Deferred | Done | |
| Rejected | Done |