I am brand new to eazyBI so please forgive my limited understanding of report generation. In Jira, we have epics with a custom field called “T-Shirt Size”. I have imported this field into eazyBI as a dimension and a property. I have created a report which list epics in rows (based on Issue) and calculated measure columns which calculate the DateDiffDays of various epic dates fields e.g. Weeks In Development, Weeks In UAT etc. I have also added a calculated measure which sums up all those durations (in weeks) to give an overall end to end time per epic. This is called “Total Weeks Design to Release”.
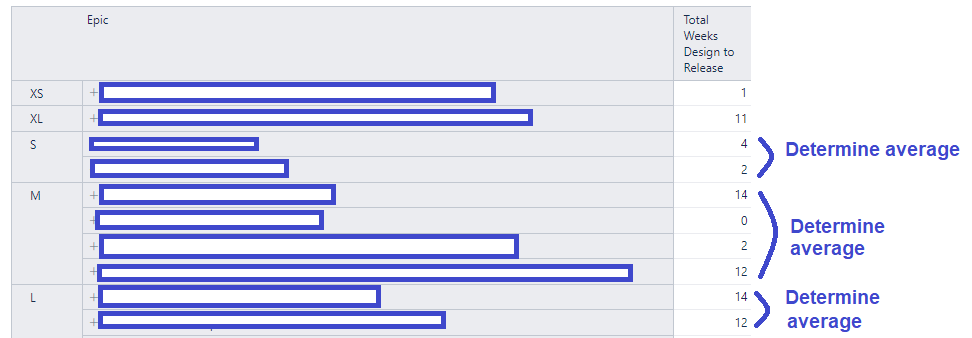
What I would now like to do is group epics by their “T-Shirt Size” value and average the value of “Total Weeks Design to Release” for each t-shirt size e.g. if I have 2 epics which are sized “Small”, and one has “Total Weeks Design to Release” = 10 and the other “Total Weeks Design to Release” = 12, I would like to calculate that the average Total Weeks Design to Release for small epics is 11.
Any assistance with this would be greatly appreciated.
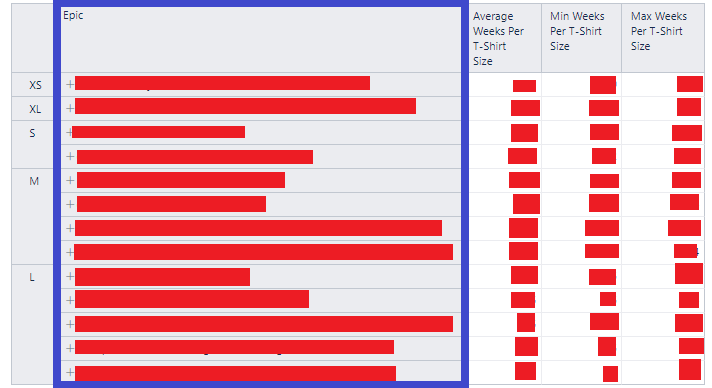
This absolutely fantastic, thank you so much. One final request - is there a way I can hide the epics themselves such that I can have a graph displaying each t-shirt size with it’s corresponding average, minimum and maximum values? I would presumably need to somehow reduce this to one row per t-shirt size.
You can use the Descendants function that will iterate through all of the Epics in the Epic hierarchy and return those Epics that have values for this measure and that have the T-shirt size selected in the Rows and then calculate the Avg/Min/Max for the measure:
Avg(
  Filter(
    Descendants([Issue.Epic].CurrentMember,[Issue.Epic].[Epic]),
    [Measures].[Total Weeks Design to Release] > 0
  ),
  [Measures].[Total Weeks Design to Release]
)
If you wish to skip the “(no epic)” members, you can add that condition in the formula as well:
Avg(
  Filter(
    Descendants([Issue.Epic].CurrentMember,[Issue.Epic].[Epic]),
    [Measures].[Total Weeks Design to Release] > 0
    AND
    [Issue.Epic].CurrentMember.Name <> "(no epic)"
  ),
  [Measures].[Total Weeks Design to Release]
)
However, for this formula to work as expected, the “Total Weeks Design to Release” needs to be based on real measures and not just issue properties.
To get precalculated days in certain cycles, you can use the Issue cycles feature: Issue cycles
This allows you to define specific cycles based on statuses, and eazyBI will precalculate the number of days each issue has spent in the cycle.
Let me know if you have any additional questions on this!
Best regards,
Nauris
Hi Nauris,
Thanks for your reply. I am a little confused as to how I use this to have t-shirt size on the x-axis and average/mix/max weeks on the y-axis, without a row per issue/epic?
Essentially I don’t want the column in blue below and I would like one row of data per t-shirt size however if I try to only have “T-Shirt Size” under rows, I see no data.
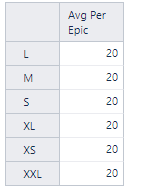
As a further update, I’ve created a separate report to try from scratch and I can create a table with a line per t-shirt size (I’m not sure why this wasn’t working on the existing report) and use your formula above however I am getting the same value for every t-shirt size and it’s definitely not correct. My “Total Weeks Design to Release” measure was defined using [Measures][…] properties.
Fundamentally, “Total Weeks Design to Release” is calculated as the sum of the number of weeks in design, weeks in dev and weeks in UAT, which are calculated using DateDiffDays on imported custom measures which provide the dates that the epics entered different development phases and then converted to weeks by dividing by 7.
Also, the import cycles page is interesting but how does that relate to issue type? We have different workflows for epics than for other issue types however there are some statuses used across different types. Will this affect other issue types in any way?