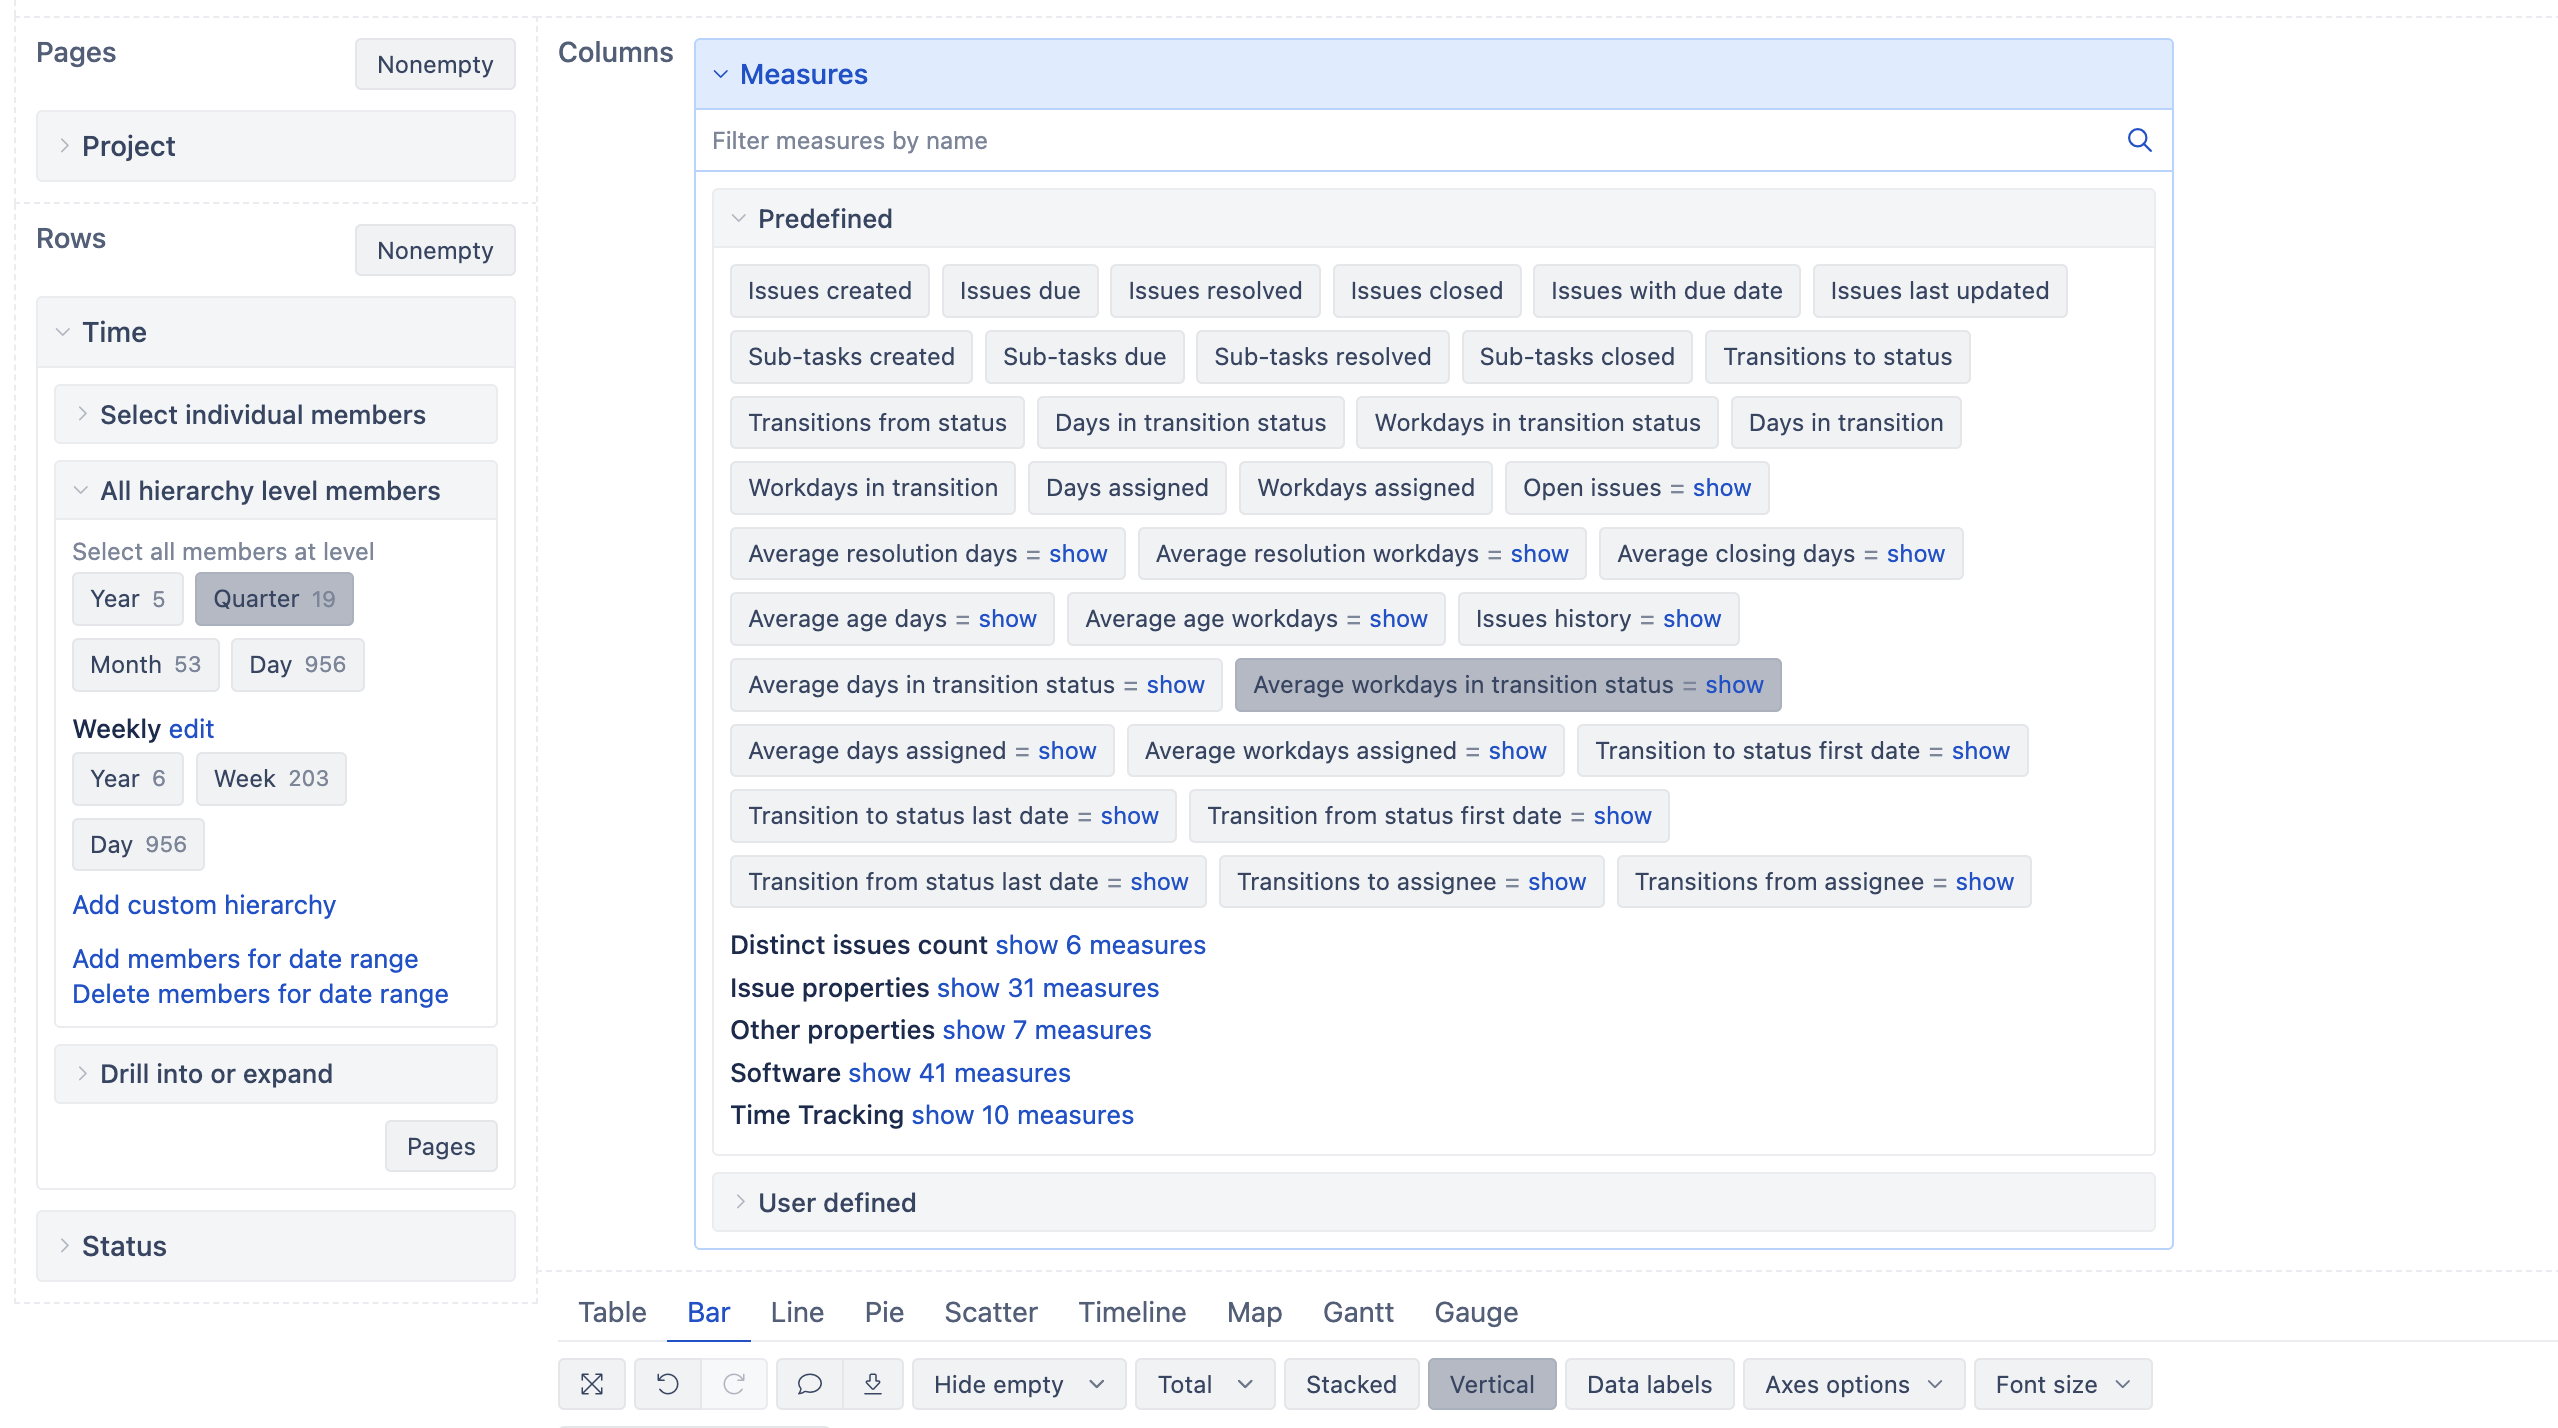
I need to build a bar graph that will allow me to track the dynamics of the change in the time a task spends in the status every quarter. The standard eazyBI measure “Average workdays in transition status” ties the time to the quarter of the task transition from one status to another, and not to the task creation date. Therefore, tasks created in the first quarter and transferred from the “In Progress” status only in the second quarter are statistically included in the second quarter, and not in the first. How can I set up the bar so that the tasks are included in the statistics of the quarter in which they were created? Now I have the time and status rows, the page is a project.
Hi @sn1ffer
The default eazyBI measures “Workdays in transition status”, “Days in transition status” and “Average .. days in transition status” would calculate results on the period when issue status is changed from
These measures are usually used with “Transition Status” dimension members to retrospectively determine how much time an issue spent in a particular status.
A custom calculation is required to calculate the workdays in transition status against the “Time” dimension period when the issue was created (not when the issue was moving out from a particular transition status)
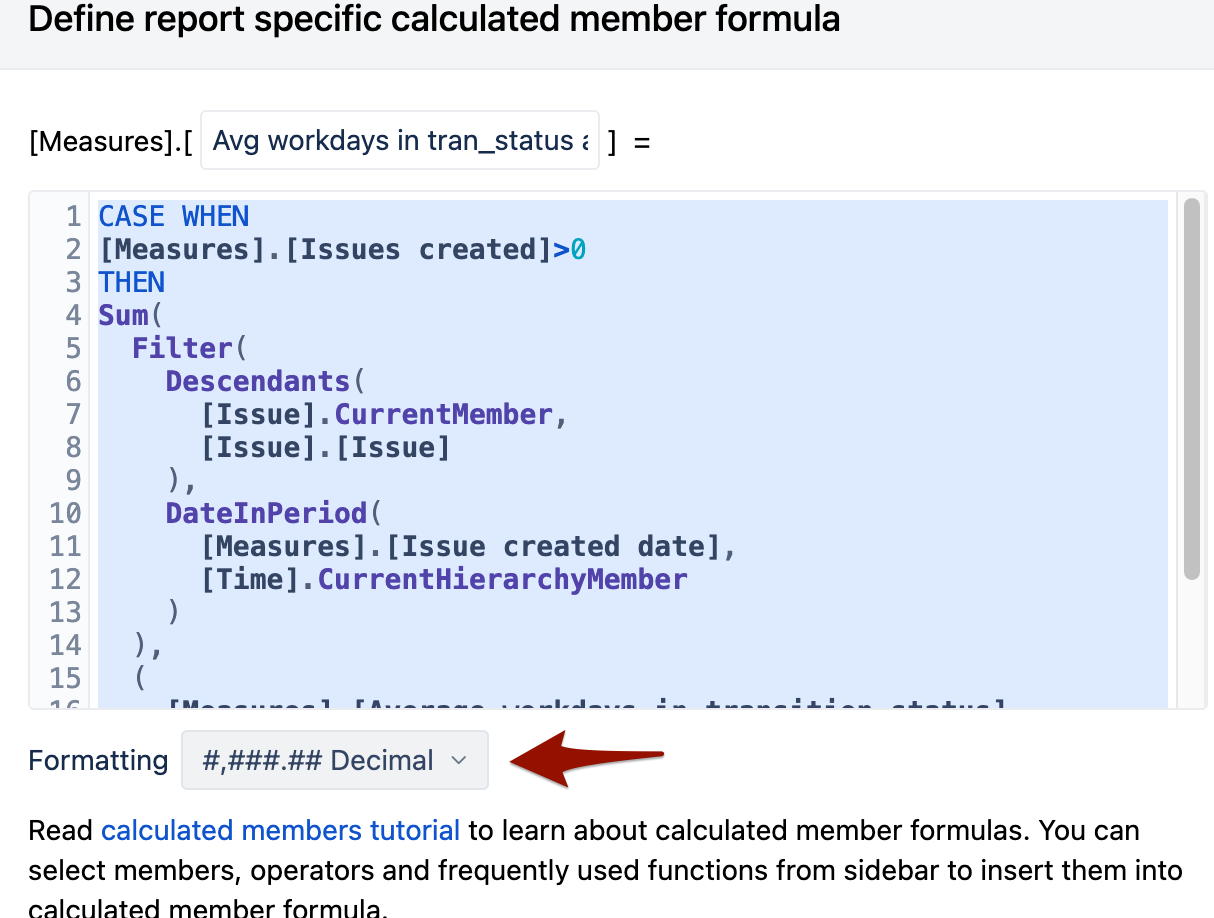
From the first glance at your report, you could try this code when creating a new user-defined calculated measure:
CASE WHEN
[Measures].[Issues created]>0
THEN
Sum(
  Filter(
    Descendants(
      [Issue].CurrentMember,
      [Issue].[Issue]
    ),
    DateInPeriod(
      [Measures].[Issue created date],
      [Time].CurrentHierarchyMember
    )
  ),
  (
    [Measures].[Average workdays in transition status],
    [Time].CurrentHierarchy.DefaultMember
  )
)
END
it fill find issues created in the particular period and then calculate the sum of avg workdays in transition status for total periods.
Please make sure you manually select “decimal” output for this calculated measure as it is quite a complex formula and eazyBI might not detect the format automatically.
If you find it slow, please contact support@eazybi.com and provide more details about the use case so we can help you optimize the report.
Martins // eazyBI support