Hello, my client has asked for the below report, but wants to exclude days spent in transition statues ‘Open’ and ‘On Hold’.
Is there a way to create a measure that shows us average resolution workdays excluding these statuses?
Thanks in advance
Joe
Hi Joe,
There are several ways to create such a report to exclude chosen transition statuses from the total calculation.
One of the easiest and fastest would be subtraction on the level of totals.
We already have a predefined measure ‘Total resolution workdays’, from which we may subtract the exclusions.
First - let us define the statuses for exclusion - we will create a calculated member within the transition status dimension and call it ‘aggregated exclusions’.
Aggregate({[Transition status].[Open],
           [Transition status].[On Hold]})
When we have aggregated the exclusions, we will be able to address them directly in a tuple.
There are two conditions for the time spent in the transition status:
- issue has been resolved;
- transition status is one of the exclusions.
So the exclusion tuple will consist of the above clauses.
([Resolution].[Done],
 [Transition status].[aggregated exclusions],
 [Measures].[Workdays in transition status])
Now - we can take the expression from the ‘Average resolution workdays’ and adjust the ‘Total resolution workdays’ by the time we want to exclude.
So the final expression is as follows:
CASE WHEN [Measures].[Issues resolved] > 0 THEN
 ([Measures].[Total resolution workdays]
 -
 ([Resolution].[Done],
  [Transition status].[aggregated exclusions],
  [Measures].[Workdays in transition status])
 ) / [Measures].[Issues resolved]
END
You can also find a similar topic in community pages about the average time spent in a transition status -Average workdays in transition status exclusion.
Please do not hesitate to look for inspiration and samples in our demo account - https://eazybi.com/accounts/1000/dashboards/5942-project-overview.
Kind regards,
Oskars / support@eazybi.com
Thanks Oskars, I used -Average workdays in transition status exclusion. and it worked perfectly.
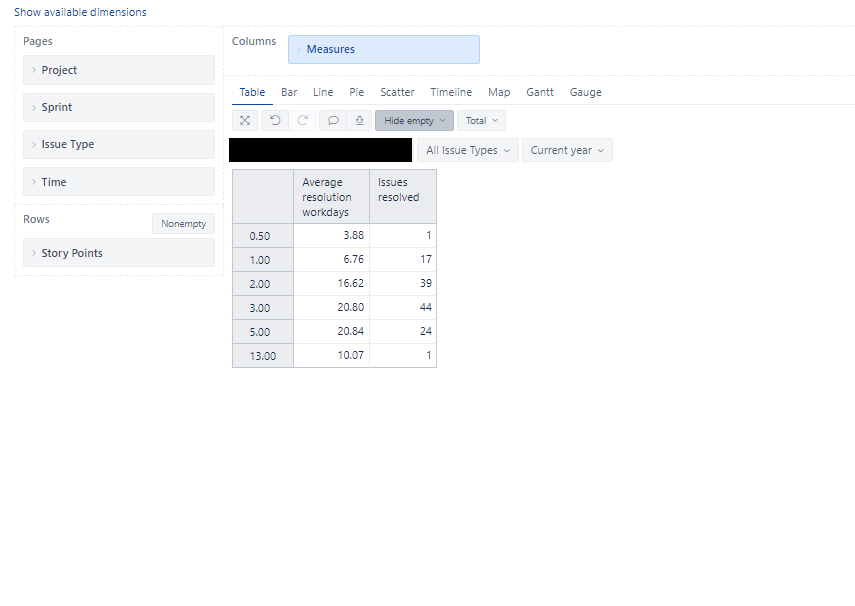
The only issue we’re seeing in the report is when we drill through the issue on the new field. I’ve used a Time filter in the pages and when it’s filtered on Q4 it works fine:
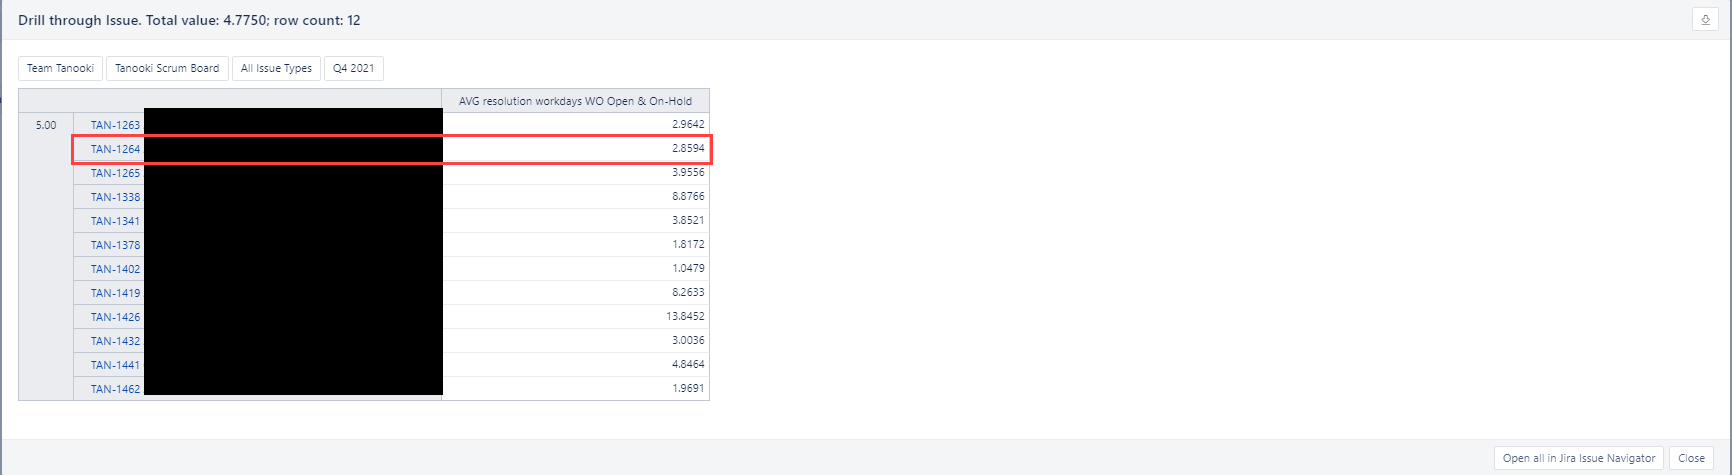
But when it’s filtered to November it shows Infinity for the same issue:

Do you know what would cause this?
Thanks again
Joey
Hi Joey,
Could you please export the report definition as described here - export report definition - and send it over to the support e-mail support@eazybi.com?
Unfortunately, provided images do not show the entire report context, thus limiting troubleshooting options.
Kind regards,
Oskars / support@eazybi.com
The issue with infinity was happening with the issues that stretched over several months. Issues had spent most of the time in one month, but resolution came in another.
The final report does not hold the issues dimension in rows. The average time spent calculates for the issues with a particular complexity represented by story points.
The solution came in two steps for easier debugging - it might be refined into one calculation.
The first measure finds the number of days spent in relevant statuses for the issues resolved in the specified filtered time interval.
The second step is to find the average days spent.
The below calculation is for finding the days spent in all but a few statuses in the whole history for the issues resolved within the selected timeframe.
It was named ‘[Workdays in Transition Status WO]’.
SUM(
  Filter(
-- iteration through the issues
   Descendants([Issue].CurrentHierarchyMember,[Issue].[Issue]),
--to retrieve only resolved wihin selected period
   DateInPeriod([Issue].CurrentHierarchyMember.Get('Resolved at'),[Time].CurrentHierarchyMember)),
--the actual figure to be summed - days in transiton status within all time excluding some statuses
   NonZero(([Measures].[Workdays in transition status],
            [Time].DefaultMember)
           -
          (([Measures].[Workdays in transition status],
            [Transition Status].[Open],
            [Time].DefaultMember)
          +([Measures].[Workdays in transition status],
            [Transition Status].[On Hold],
            [Time].DefaultMember))))
And the measure for calculating the average.
CASE WHEN [Measures].[Issues resolved] > 0
THEN
 [Measures].[Workdays in Transition Status WO]
 /
 [Measures].[Issues resolved]
END
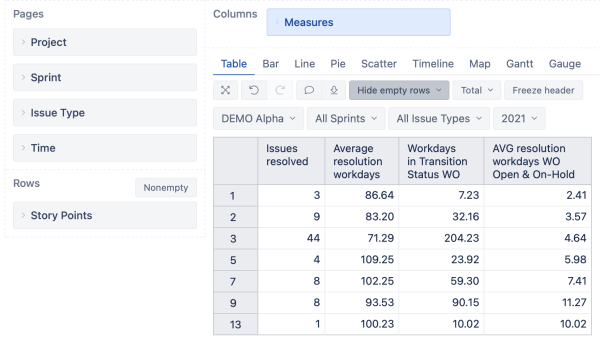
So the final look of the report was as follows.