Hi there,
I’m currently struggling building a report that shows a burndown to a specific number, but not 0 by a target date.
the 1st thing I’m struggling is to calculate a Measure that describes the specific number mentioned above. In my case it should be the number that calculates to the avg number of issues resolved within 2 weeks.
the 2nd thing is to build the burndown to not 0, but to that specific metric.
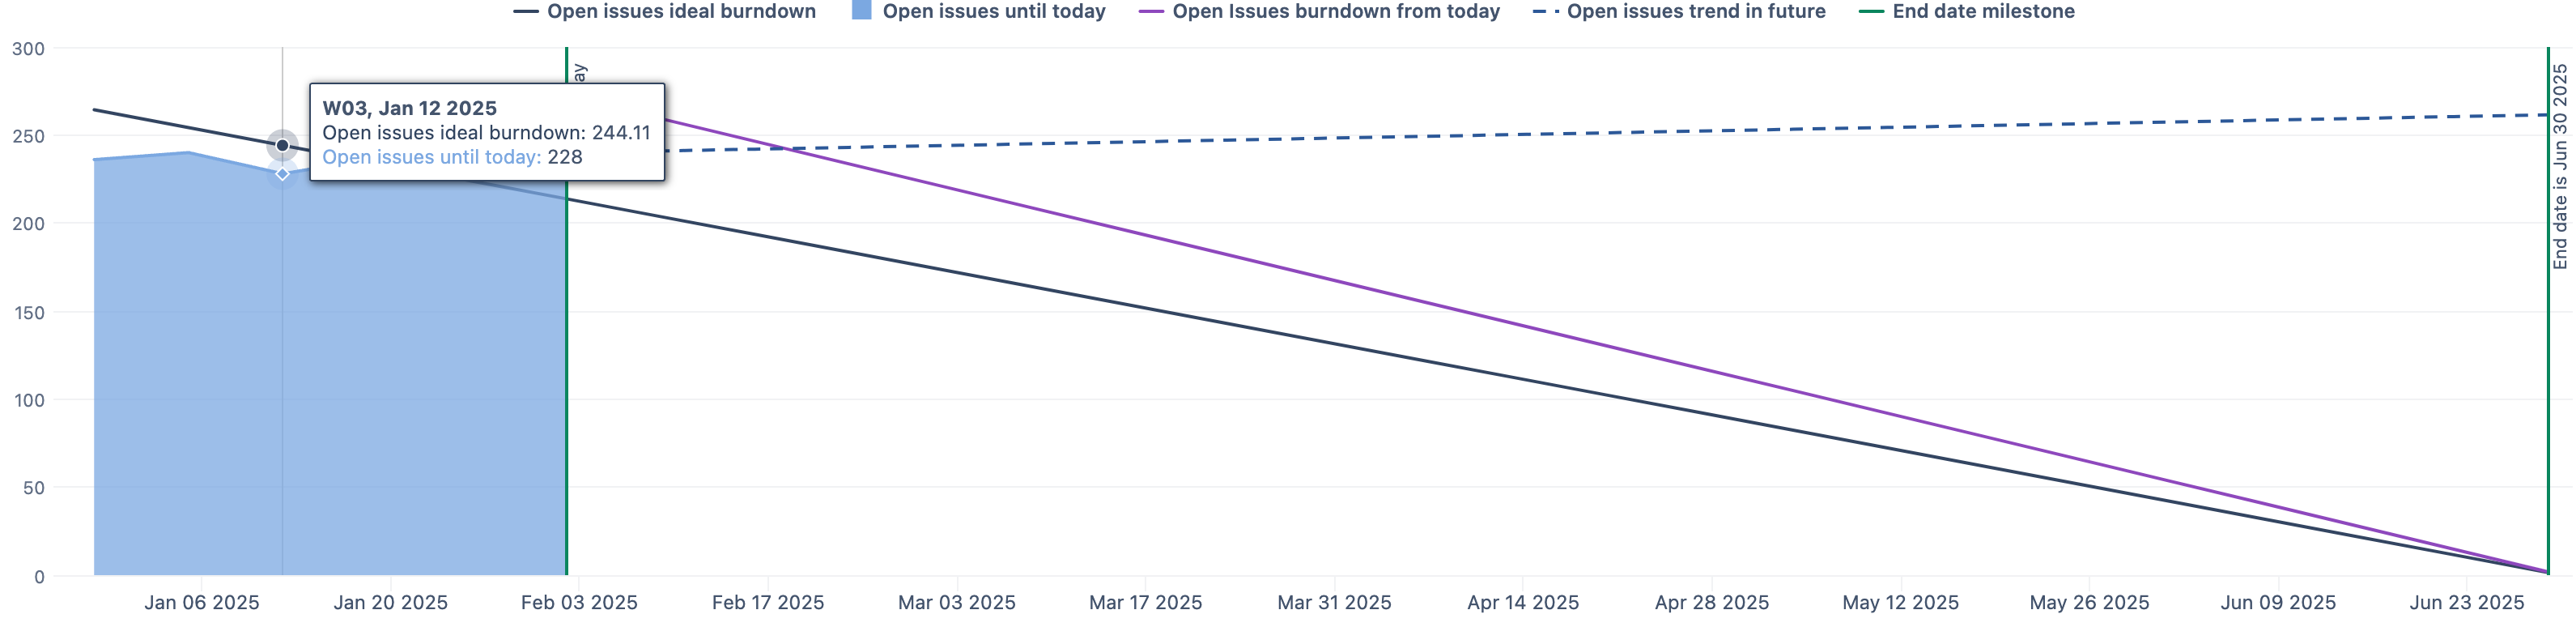
I was using the open issues trend example and tried to change the Open Issue count to a even a hardcoded measure, but it always got to 0 instead of the hardcoded number.
Can somebody please help?
Cheers, Felix
P.S. Additionally, it would be amazing to avoid the trendline going negative
Hi @felix.geelhaar,
The Open issue trend is built on top of dates. The burn down goes down based on the initial value (open issues at start) and the duration between start and end, and the current position on the Time dimension.
The trend is not limited by zero, but the report filter - it will go into negative values if the date filters are removed.
To determine the average number of issues resolved within the last two weeks, I recommend the following calculated measure:
--- Average issues resolved previous two weeks
Avg(
  {[Time.Weekly].[Week].CurrentDateMember.Lag(2):
   [Time.Weekly].[Week].CurrentDateMember.PrevMember},
  CoalesceEmpty(
    ([Measures].[Issues resolved],[Time].DefaultMember),
    0
  )
)
To stop the trend approximately when it nears the desired number, you can define a new calculated measure that checks whether the trend has reached the value and stop displaying the value before that. The formula could look similar to the one below:
CASE WHEN
  [Measures].[Open Issues burndown from today] >= [Measures].[Average issues resolved previous two weeks]
THEN
  [Measures].[Open issues burndown from today]
END
Best,
Roberts // support@eazybi.com
2 Likes
Thank you @roberts.cacus. That solved my issue 
Appreciate your support
1 Like