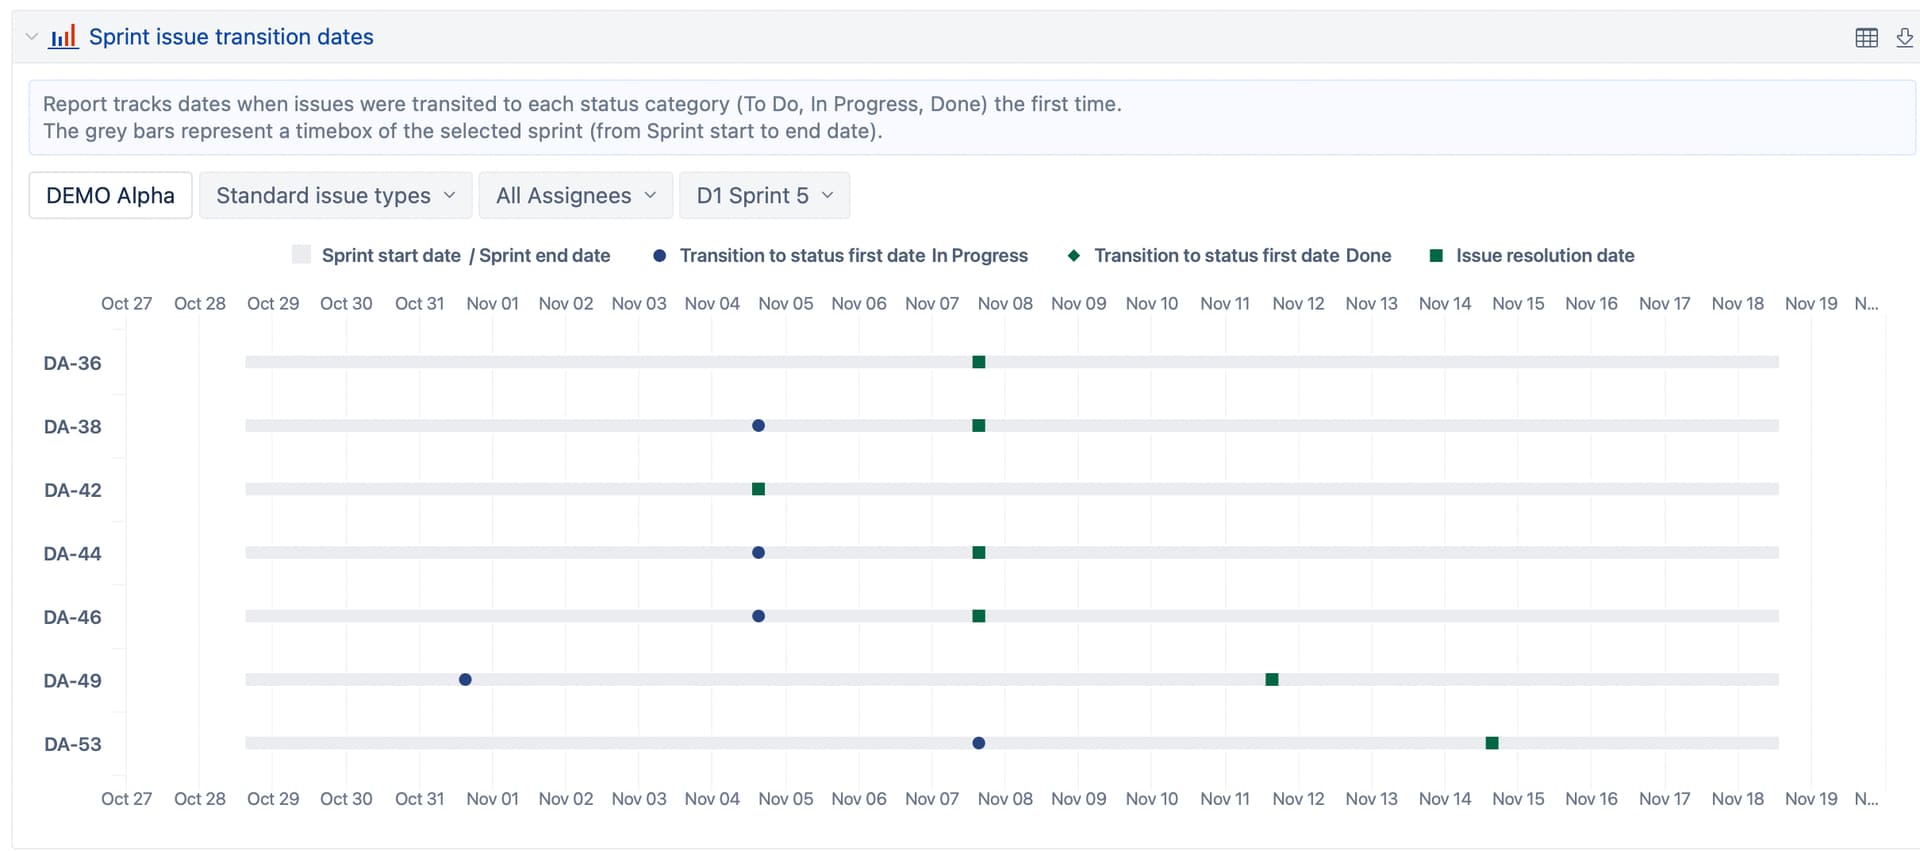
I found your beautiful bar chars as Gantt charts and have one question to it:
Is it possible to position a value in the timeline and if I do a mouseover over the value I see the value (for example quantity of all linked issues) and not the time stamp?
The chart shows all information available in the Table view. If the information is numeric or date and could be charted, you see it as line, bar, scatter, etc. On the other hand, if the table column contains text, it could be visible only on mouseover and can not be charted.
This is what you can do:
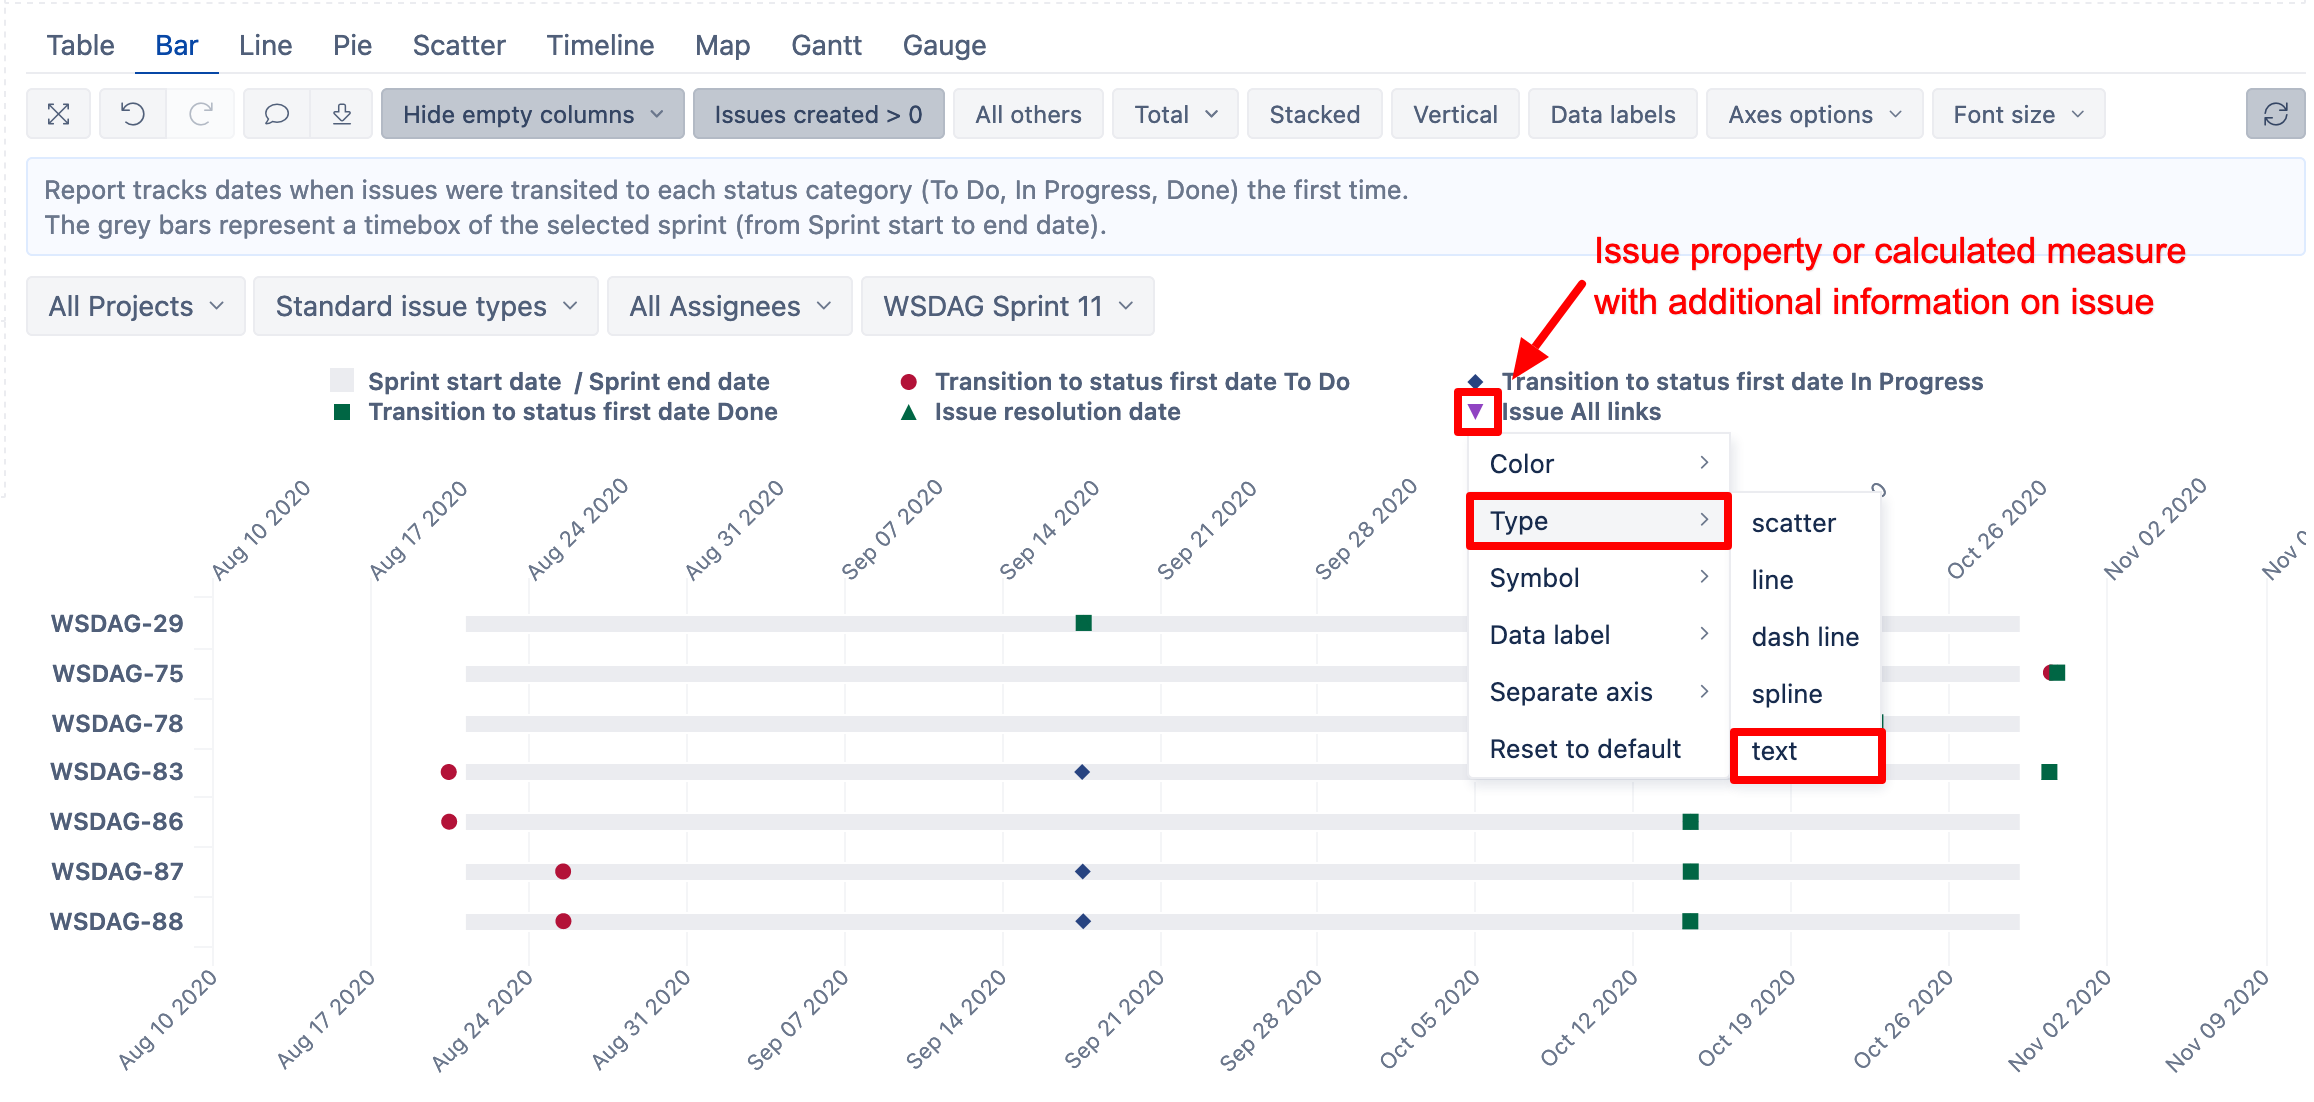
Create a report-specific calculated measure that woudl contain some additional information on each row. For example, it might be an issue property or a generated value of several properties and measure values.
Anyhow, set measure formatting to Text >> Plain.
Add the calculated measure to the chart. Set measure representation type in chart Type >> text.
(see picture below).