We would like to count subtasks by Status:
To Do
In Progress
Done
So that we can have a stacked bar graph showing movement.
This would be a big improvement over the Gantt chart.
Right now we can get Done and ‘Unresolved’ by subtracting Done from Created but cannot get the middle In Progress
1 Like
Try exploring the following demo report example:
https://eazybi.com/accounts/1000/cubes/Issues/reports/72782-issue-status-changes-blocker-stories-bar-as-gantt
It shows the movement between statues on a Time scale.
Martins / eazyBI team
Thanks Martins and very interesting. What we have is a simpler request.
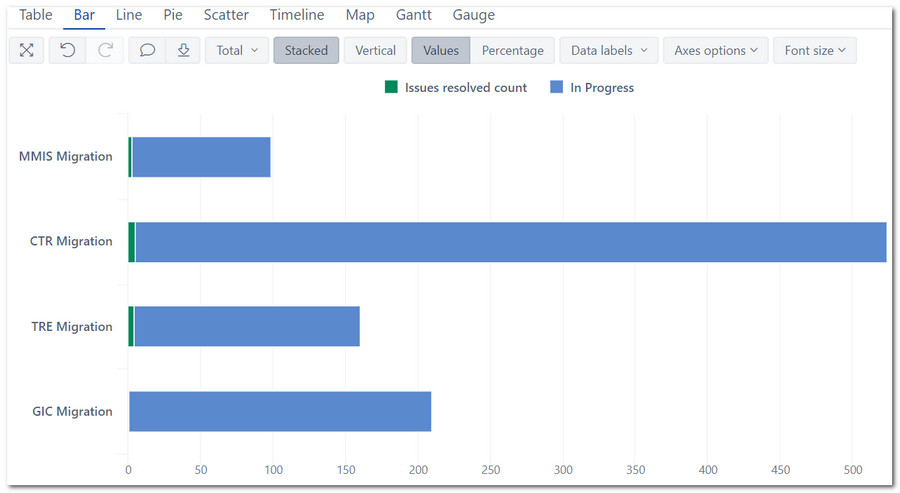
We currently have a bar chart of sub-tasks resolved versus In Progress.
We would like split up the count of In Progress to To Do, Scheduled and In Progress since this would delineate better the state of the sub-tasks. Therefore we need a count of the number of sub-tasks by state. Again, any suggestions and guidance is appreciated.
In this case, you could create new calculated measures (one for “To-Do”, one for “Scheduled” etc) using tuples.
https://docs.eazybi.com/eazybi/analyze-and-visualize/calculated-measures-and-members/calculated-measures#Calculatedmeasures-Tuples
Try this code for one them
(
[Measures].[Issues created],
[Status].[To Do]
)
Martins / eazyBI team
1 Like