Hi
I am new to EazyBi so my termanology might not be the best.
I have created a bar chart with two dimentions one on the Y axis - Product.
One on the Stacked bar axis - Origination
The origniation is a hierarchy level set. with two levels.
If I print it in table format it looks something like below
But when I put to Bar format, it only shows the second hierarchy value (A,B,C) in the legend. And removes all details on the first level (1,2,3). Is there a way not to lose that first level information or include in the legend.
Hello @ajinmelb,
Thanks for posting your question! You are right; when adding two levels in columns, you can only see one. The workaround would be to move it to Rows instead.
I suggest creating the report following the steps described below. Note that I don’t have dimensions named Product and Origination, so I will be using Status and Priority respectively, however the principle remains the same.
- add Status (or Product) dimension in Rows. I picked “All Statuses by category” member in this dimension for my report.
- left-click on the “All statuses by category” and choose “Drill into level” → Category
- left-click on the “Issues created” and choose “Drill into” → Priority → Priority (or Origination in your case)
You can read more about Drill into function in our documentation here: Interact with report
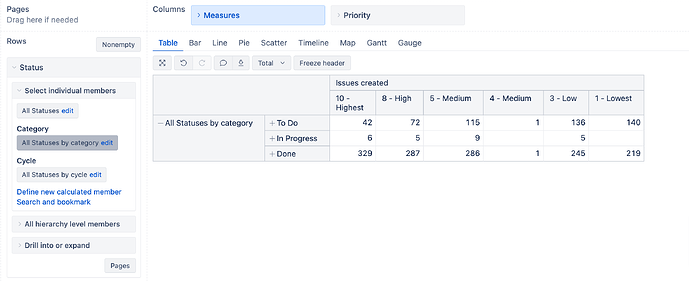
Here’s an example of the report I am getting in a Table view:
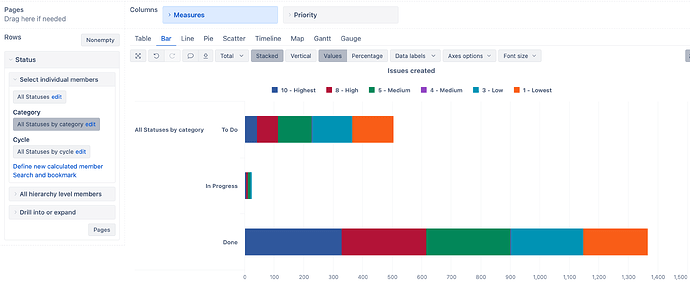
Once I switch to the Bar chart & choose Stacked, I get “All Statuses by category” in front of the chart, then Status categories & Priorities are stacked on the X-axis. You should be able to replicate similar results with your dimensions of Product and Origination.
Best,
Marita // support@eazybi.com


