I’m trying to create a report that will display users grouped by Tempo Teams in rows, with customer satisfaction ratings in columns.
I’ve figured out that [Logged by Teams] and [Logged by] dimensions as rows can provide me with grouping of users into teams. But I’ve ran into a wall trying to figure out how to count customer satisfaction ratings per issue in columns. When I select [Logged by Teams] and [Logged by] dimensions as rows the only measure that works apparently is [Hours spent]. If I select [Issues created] measure nothing happens for some reason (I’m guessing these dimensions have only [Hours spent] measure in them, so other measures don’t have any data to show). But if I add [Issues] dimension to the rows or drill across issues the report somehow correctly shows which issue has been worked on by which user and for how long.
Instead of Jira Service Desk we have a plugin “HelpDesk for Jira” by Teamlead. So customer satisfaction ratings are stored in a custom field. There’s a dimension [Rating] that I’ve added to the columns. Which lead to column [Hours spent] being split across 6 possible values.
How can I add rating counts and average rating to columns, so that I could see how many issues that a user worked on were graded by the customer with specific rating?
Hi @nikolay.nekrasov,
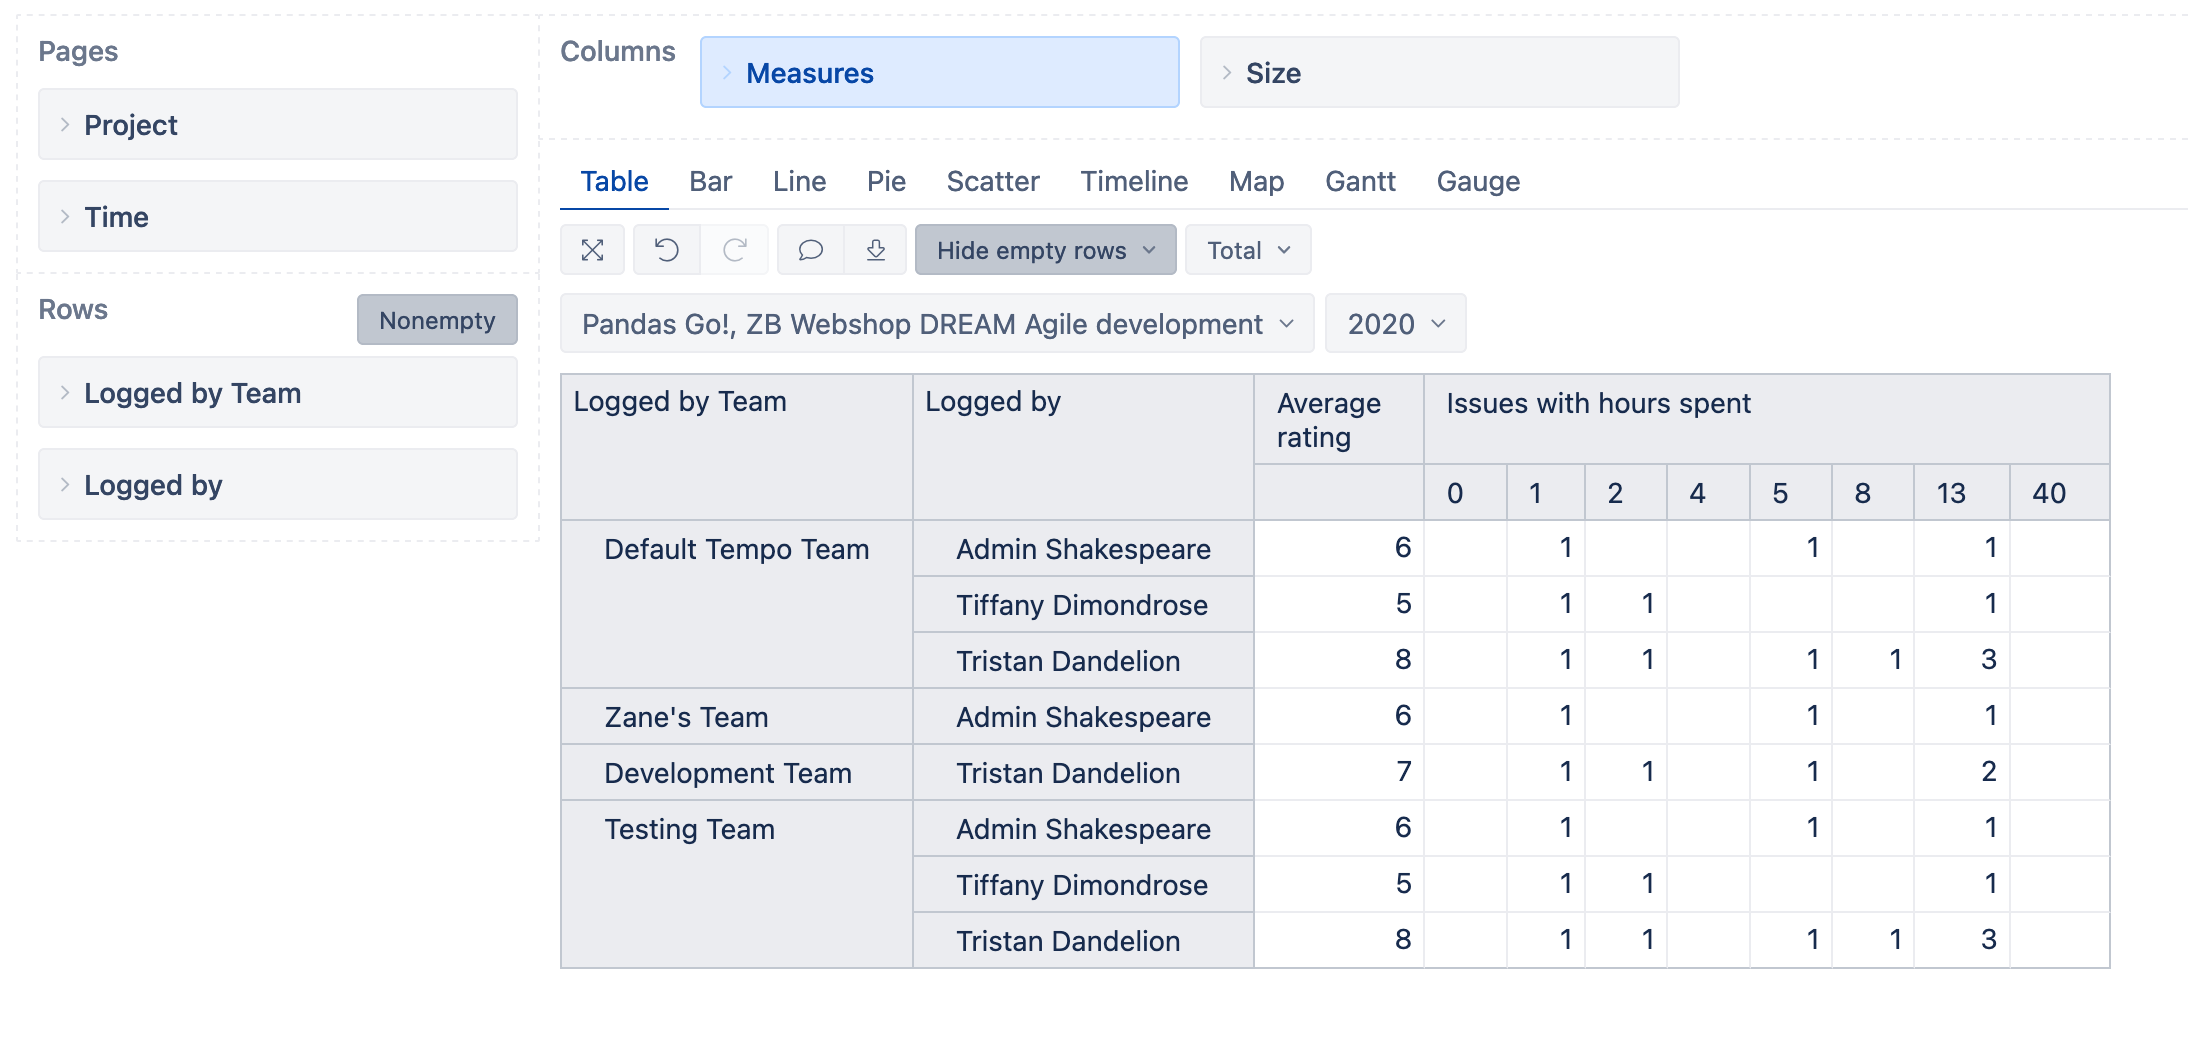
For your report, you might want to use measures “Issues with hours spent” to see how many issues each user has worked (registered hours). This measure works well also with issue custom field dimensions, like “Rating”.
-
In Measures, define a new calculated measure “Average rating” to calculate how many issues users worked on has each rating and transfer that to a numerical value. If the “Rating” dimension members are numbers, for example, 5, 4, etc.) then you can easily transfer them as numbers for calculation operation purposes (for multiplying). The expression for “Average rating” might look like this:
 --total amoount of rating points
 Sum(
   Filter(
     --go through rating values that are asigned to issues user worked on
     [Size].[Size].Members,
     [Size].CurrentMember.Name <> "(none)" AND
     [Measures].[Issues with hours spent] > 0 ),
   --sum up total rating for a user multiplying issue count with rating value
   [Measures].[Issues with hours spent] *
   Cast([Size].CurrentMember.Name AS NUMERIC)
 ) /
  --divide by count of issues that users worked on and has rating to get average
 (
   ([Measures].[Issues with hours spent],
   [Size].CurrentHierarchy.DefaultMember)
    -
   ([Measures].[Issues with hours spent],
   [Size].[(none)])
 )
more details on calculated measures are here: Calculated measures - eazyBI for Jira
-
On the report columns set only Measures “Issues with hours spent” and new calculated measure “Average Rating”. Make sure the “Rating” dimension is not in the report yet.
-
Klick on measure “Issues with hours spent” and select to “Drill into” dimension “Rating” (see more details here: Drill into measure by another dimension level )
The report might look like the picture below.
Best,
Zane / support@eazyBI.com
Thanks a lot! The average calculation expression and the “Issues with hours spent” measure are just what we need!