I have been playing a bit with eazy BI today, finally managed to create myself a couple of filtered burndown charts but I’m struggling a bit to create a RELEASE based burndown chart with a proper remaining story points guideline (the doted line that gives you an idea of the ideal burndown of points).
Also I would like the X axis (time) to begin at a point in time I determine manually if possible, and have the end of the time axis be the release date of that version.
Anyone that might be able to help me on how to create such a chart?
In the Sprint burn-down chart that you used as example there is the ‘Time within Sprint’ calculated field that shows 1 for each time period that is between Sprint start and end date. This is used for chart display (only show time periods where this field is greater than 0) and in ‘Sprint Story Points remaining trend’ calculation.
So here is what you would do to create ‘Time within Version’ calculated member:
Create a calculated measure called, e.g., ‘Chart start date’ where, as requested, you can manually specify when the chart should start being displayed with following formula
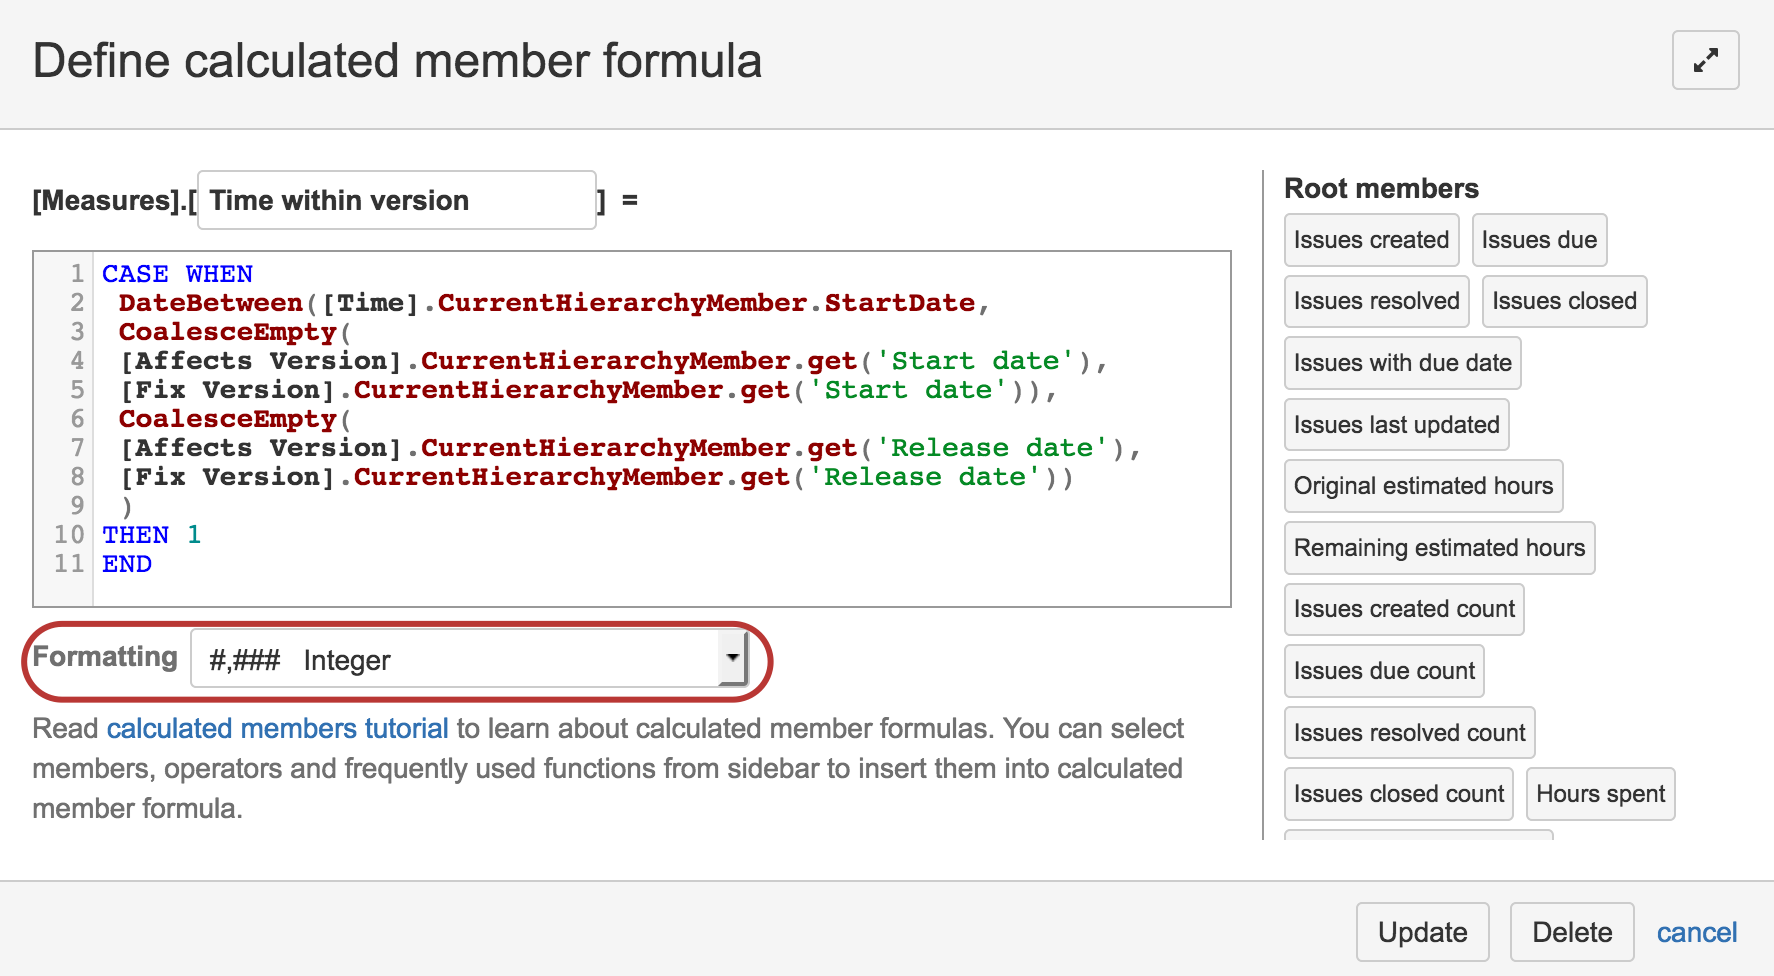
Create the ‘Time within version’ calculated member which uses the Chart start date and the version release date CASE WHEN DateBetween([Time].CurrentHierarchyMember.StartDate, [Measures].[Chart start date], [Measures].[Version release date] ) THEN 1 END
Create the ‘Version story points remaining trend’ with following formula. This will show the trend for period starting in Chart start date and ending in Version release date. LinRegPoint( DateToTimeStamp([Time].CurrentHierarchyMember.StartDate), Filter([Time].CurrentHierarchyMember.Level.Members, [Measures].[Time within version] > 0 ), [Measures].[Story Points remaining], DateToTimeStamp([Time].CurrentHierarchyMember.StartDate) )
Please let me know if you have further questions regarding this!
Kind regards,
Lauma
For some reason, the column Time within Version and Version Story Poitns remaining trend are returning “mmmm dd yyyy” instead of actual values… Im pretty much a newbie on this sadly .
eazyBI is trying to guess what should be the formatting of the result by looking at what measures are used in the formula - e.g., in case there are many dates, it thinks the result will be a date. Please change the formatting of “Time within version” to Integer and let me know if that helps!
 I will look into that!