Bug "Burndown" Report

Hello everyone,

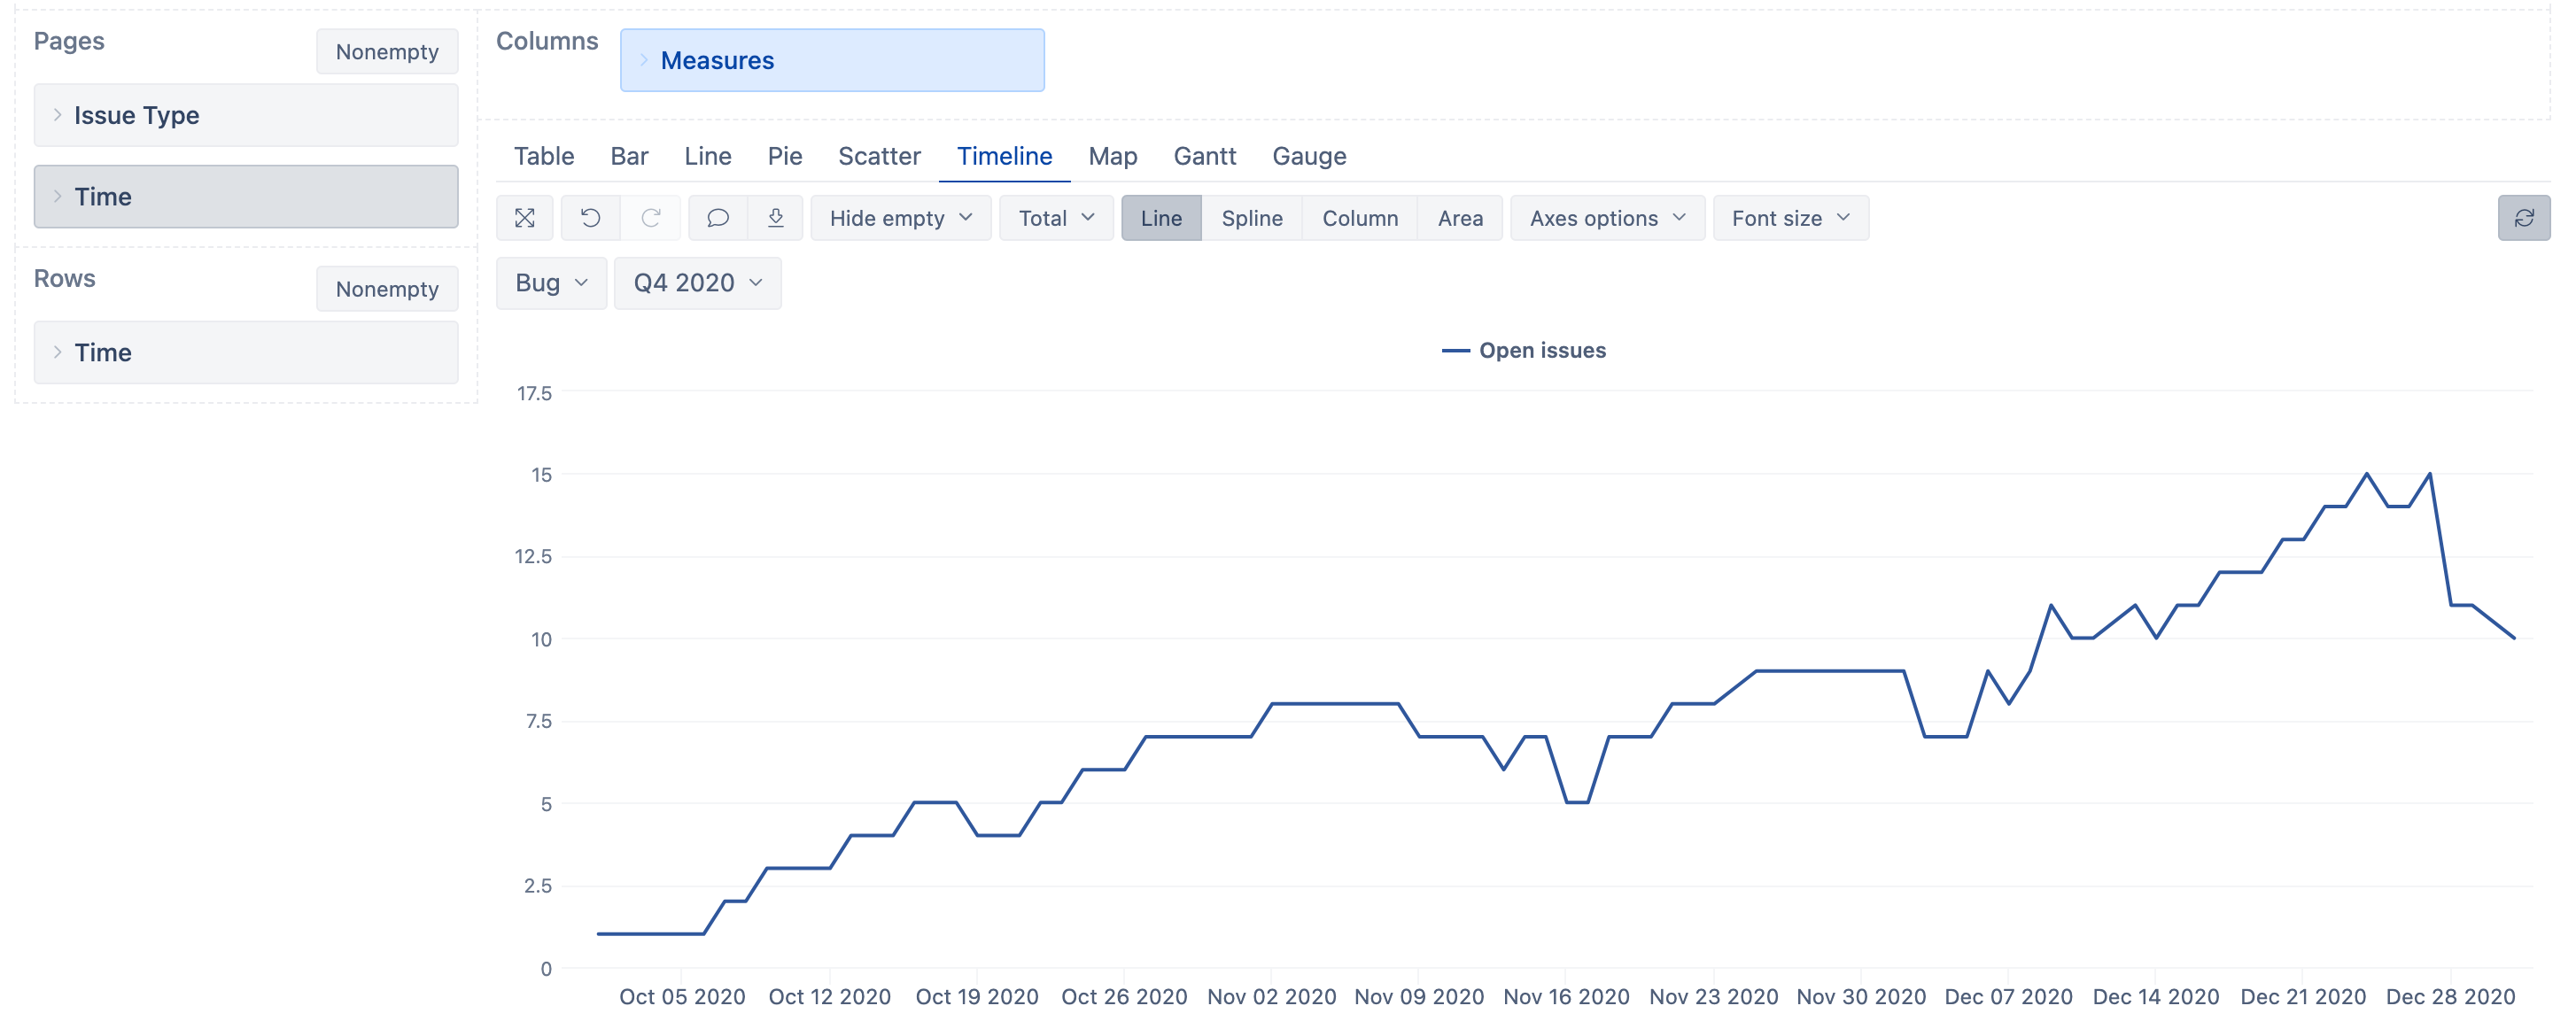
I am looking for a report app that could give me the number of unresolved bugs per day for a given period of time. I was wondering if this would be possible with easyBI?

Ex.:

Monday April 1st : 150 unresolved bugs
Tuesday April 2nd: 145 unresolved bugs
Wednesday April 3rd: unresolved160 bugs

It would be nice to have it displayed like this:

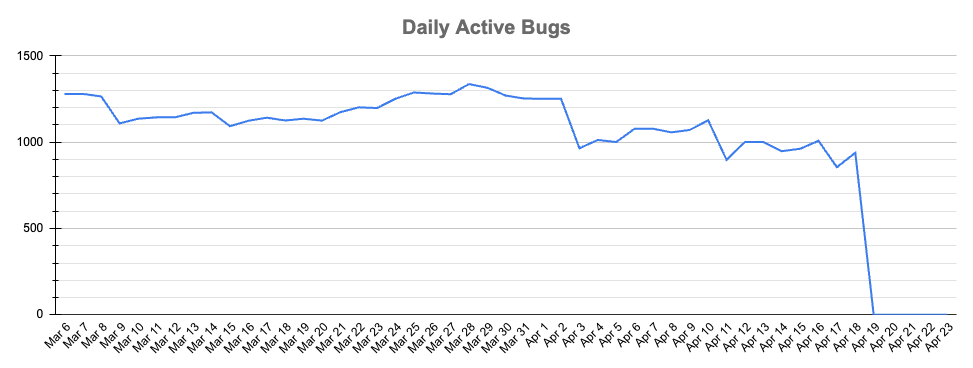
We are currently exporting the list of all unresolved bugs each day and importing the list in a Google Sheet to create this report.

Thanks in advance for your input :slight_smile:

Gabriel

Hi Gabriel

You may want to create a report with the Time dimension in rows and measure “Open issues” in columns to show unresolved issues at the end of each day (week, month - whatever period is selected in rows).
Add, in Pages, Issue Type dimension and filter by bugs. Also, add Time additionally in Pages so you can filter days in rows by months/quarters: Create reports
Then choose Line chart or Timeline chart to represent data as a chart.

See an example report.

Best,
Ilze, support@eazybi.com

1 Like

Thank you for your response ilze :slight_smile: