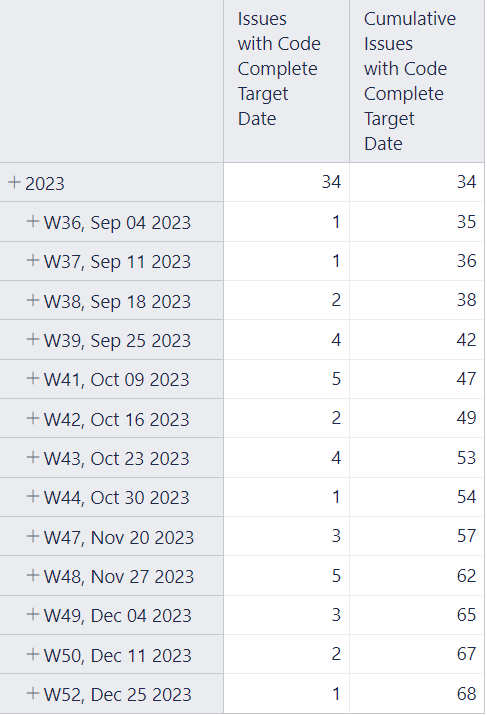
Hi, I would like to draw a burn up chart based on custom ETAs. I managed to get a bar chart showing issues that will be completed every week using time as dimension and “issues with code complete ETA” as measure. I see that the table has one row for the sum of all issues(the top row) . I would like to exclude this row from the table/resulting bar cart. How can I do this?
Hi,
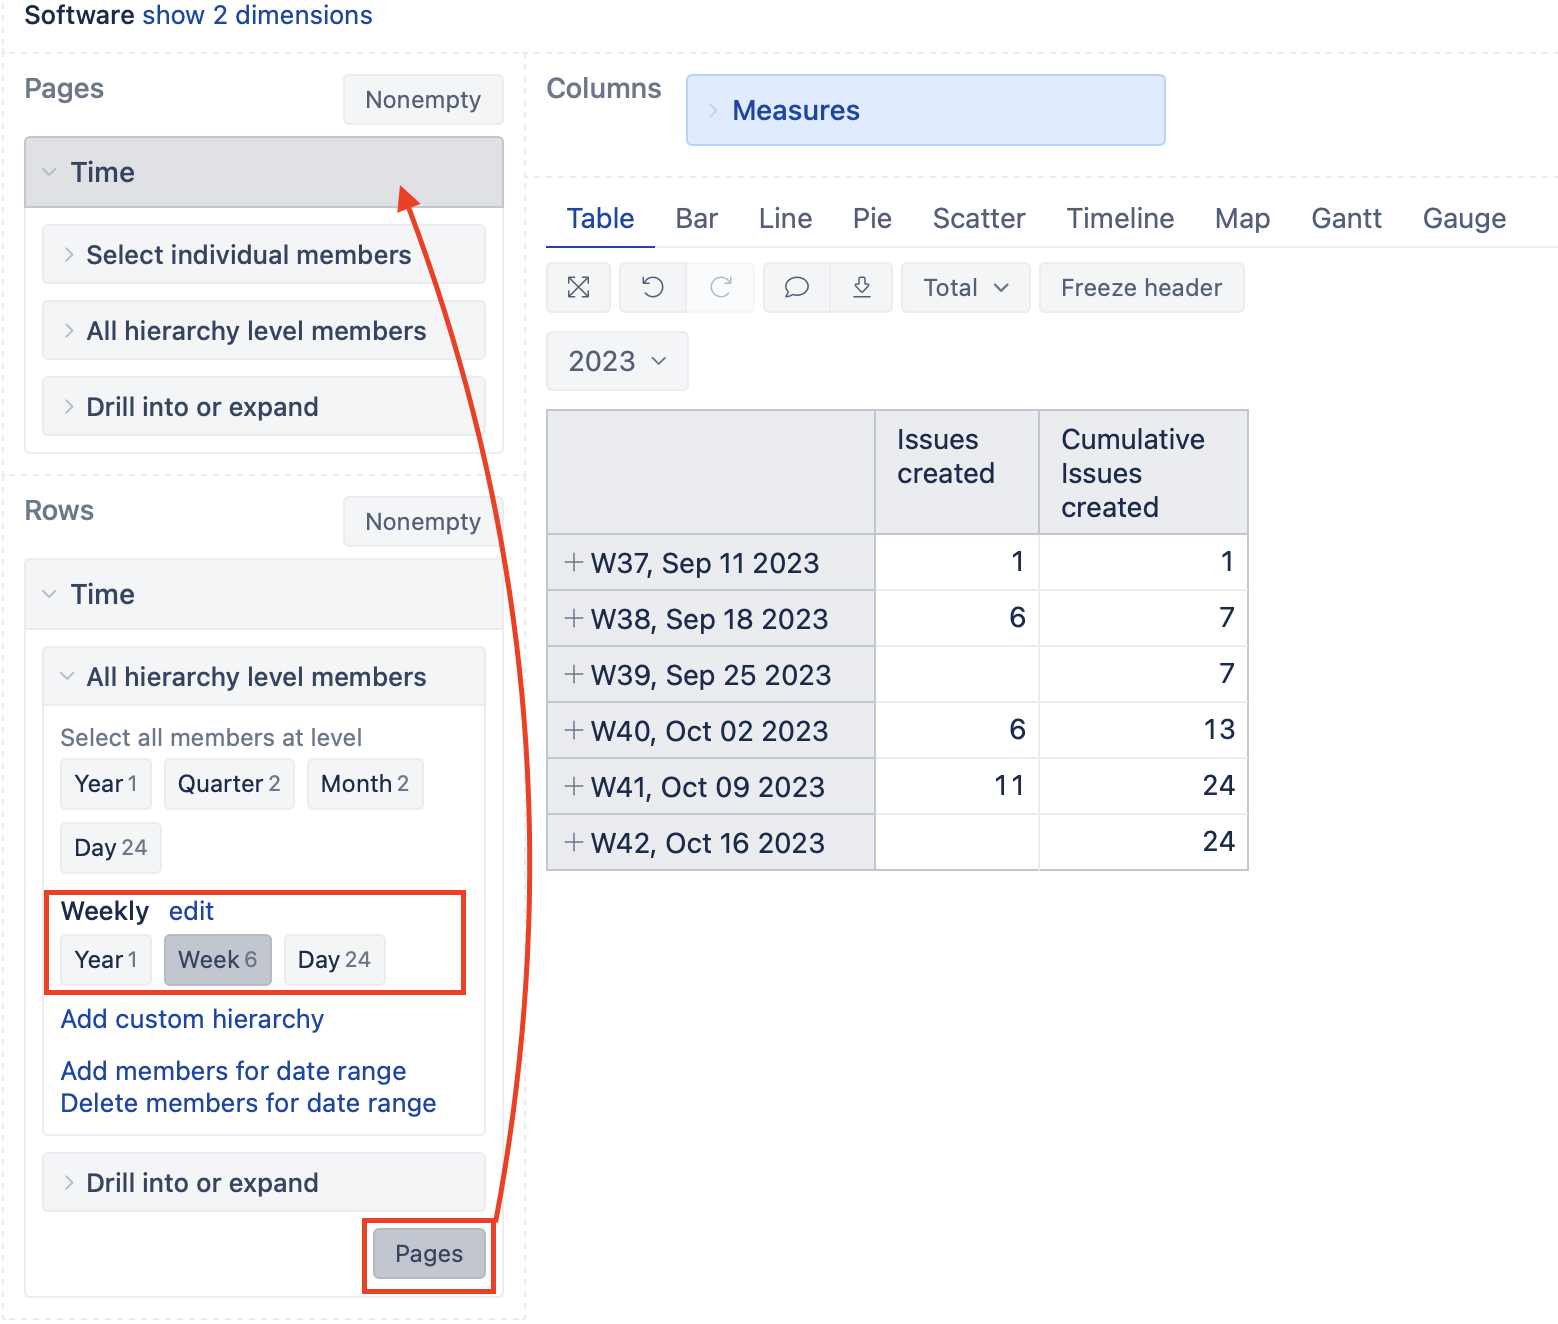
To remove the top row, click on the Weekly dimension level “Week”. This will leave only weeks in the report results. In the Rows section, you can also click on the “Pages” button to make the Time dimension available in Pages.
This way you can show weekly numbers in the report and use Pages to filter data for only one year (or the last 12 weeks or other filter as needed).
Let me know if that works for you.
Kindly,
Ilze