Hello everyone,
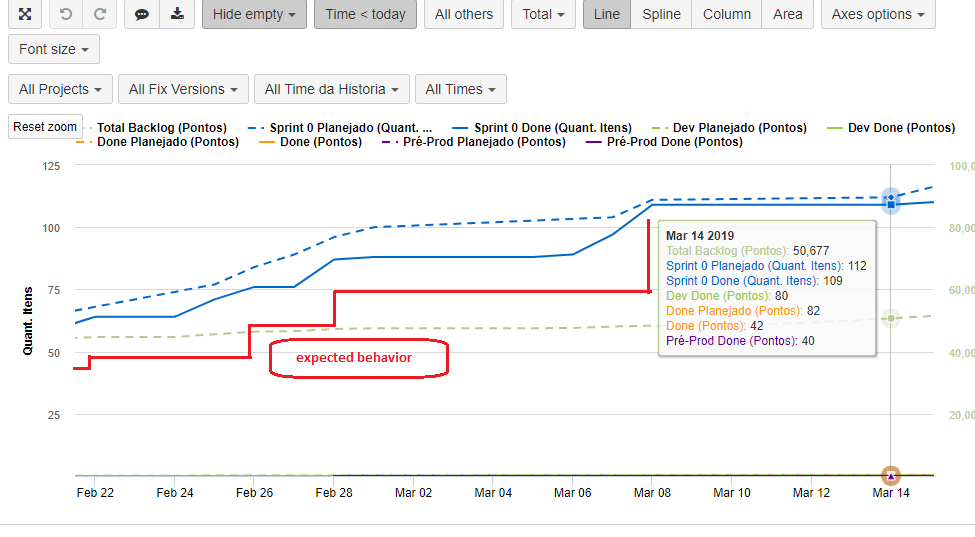
I have a report that shows an estimated date line and a ready line both are Jira custom fields and it works very well. But my boss asked that the line drawing be the same as Jira’s burnDown, that is, the line must go horizontal until it has a new value.
When there is a new value, the line goes up and continues walking horizontally until a new value is entered.
My custom field is this:
Plan Measure.Dev (Points),
CASE WHEN [Measures]. [Issues with planned dev]> 0 THEN
Cache (
NonZero (Sum (PreviousPeriods ([Time] .CurrentHierarchyMember),
[Measures] [Story Points with planned dev]
))
- [Measures]. [Story Points with planned dev]
)
END
can you help me?
Thank you very much in advance.
Danilo Ferrari
Hi @Danilo_Ferrari
Welcome to eazyBI community 
The line chart in eazyBI would not be displayed so robust as in Jira charts.
The closest look would be if you switch to Line chart type and select “Day” level from “Time” dimension but anyway they would appear as in Jira Charts.
I just created a new feature request for our backlog and added your question to vote for it, but I can’t promise any estimates for such development.
Martins / eazyBI support
Hi @martins.vanags,
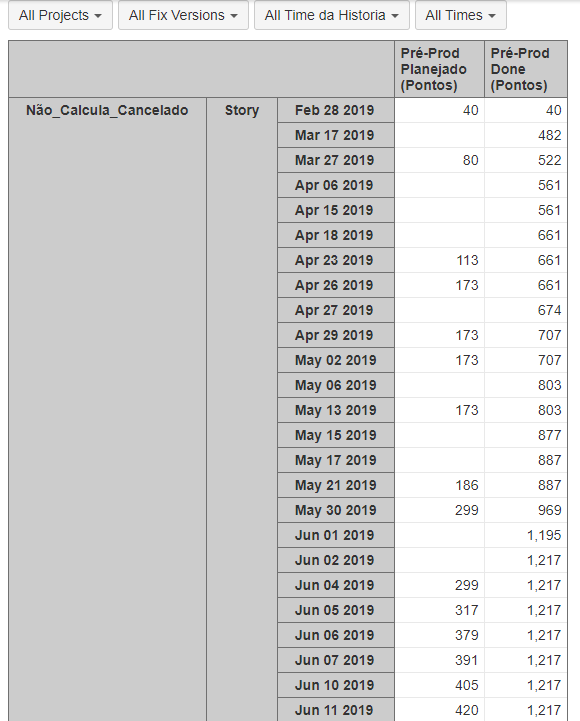
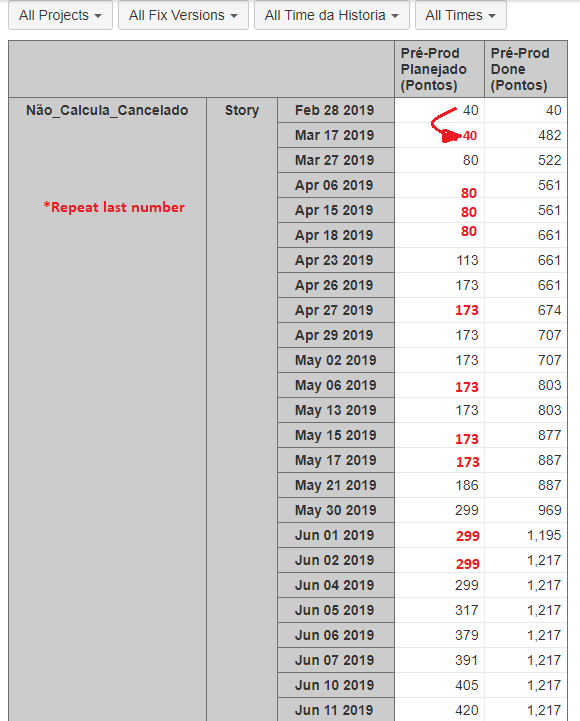
Is there a way to repeat the last value if there is no value the next day?
if so, you will be able to see the nearly equal horizontal line in Jira reports.
Thank You in advance !
Danilo Ferrari
Hi,
Try this code for the calculated measure (but replace the “Issues created” in the code with the measure which you have in the first column - two places in the following code).
Cache(DefaultContext((
    [Measures].[Issues created],
    Tail(Filter(
      [Time].[Day].Members.Item(0):
      Tail(Descendants([Time].CurrentMember,
        [Time].[Day])).Item(0),
      Cache(NOT IsEmpty(DefaultContext((
        [Measures].[Issues created],
        [Time].CurrentMember
      ))))
    )).Item(0)
  )))
Martins / eazyBI