Is it possible to do a burnup using the stories in the active and future sprints for after today ?
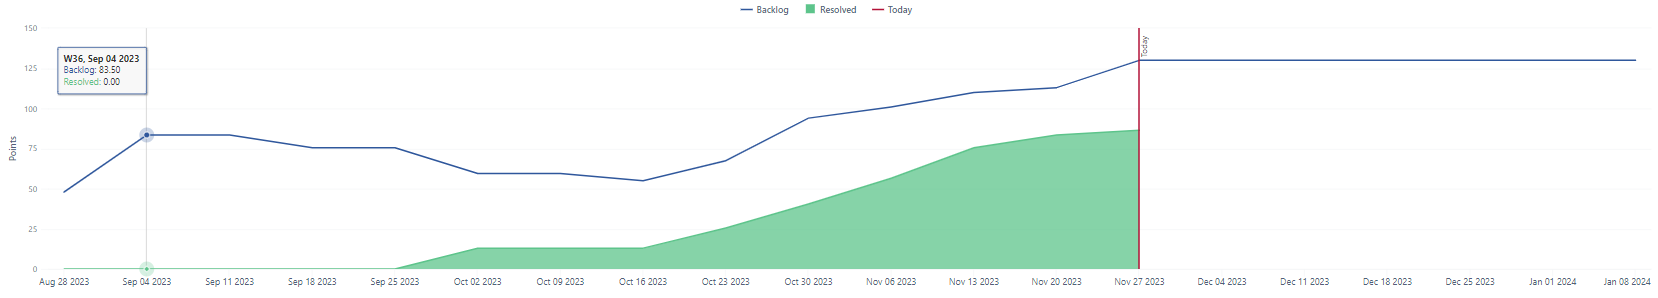
My actual burnup ends today. I would like to show the future by using the not closed stories which are in active and future sprints. The dates of sprints could be used to predict the closure of the stories.
I know these examples. It is not my need.
I would like to use the story points which are in the current and future sprints, considering that they will be resolved in those sprints.
“Story points history” default measure includes the sum of story points for all statuses (including “Resolved” status) and I find it strange to call it as “Backlog.”
Do you use any page filter dimensions in your report?
Anyway, please tell more about the requirement, do you expect that all issues from the sprint are linearly resolved by the last date of the future sprint?
It seems I’m not clear. Sorry.
I would like to show the future (after today) by using the not closed stories which are in active and future sprints. The predicted date of resolution of stories would be the end of the sprint each story is in.
Let’s say there are 2 future sprints, one with end date Jan 01 2024 and another with Jan 01 2024. The first sprint has 10 open issues, the second 15 open issues.
How would your prediction line look like in the chart which has weeks on x-axis? Would that be some linear guideline from Nov 27 till the last end date of both future sprints and is connected with your “Resolved” measure data point on Nov 27?
OR a line that goes flat until Jan 01 then increases by 10 and goes flat until Jan 08 where it increase by 15?
Ideally : linear guideline from Nov 27 till the last end date of both future sprints and is connected with your “Resolved” measure data point on Nov 27
If it’s not possible, a flat line between each end of sprint could be suitable.
Hi,
Are you expecting to filter report by “Time” and “Sprint” dimensions as well?
How would that work then?
Let’s say you have 2 future sprints for calcuations but you filter just one of them? what should your chart show then?
The same with “Time” dimension. Let’s say you have two future sprints that end in Jan 2024, but then you filter report by “Time” dimension and filter 2023, where would your guideline stop in the chart if Jan 2024 is not included in the Time dimension filter?
Hi,
I’m not expecting to filter by Sprint. Only by time to stop when all the story points are resolved.
I would like to include all issues matching other filters.
If 2024 is not displayed, all the issues in the sprints in 2024 will not be included in the guideline. So, the prediction will not hit the target.