Hi @sfruchter,
The base layout for this report would be the measure “Story Points resolved” and the dimension “Project”. Representing Story points resolved by Project and by Component in Table report is straight forward - you can click on Project and drill into the Component level.
However, for a stacked bar chart you might want to have Project and Component as a separate dimensions.
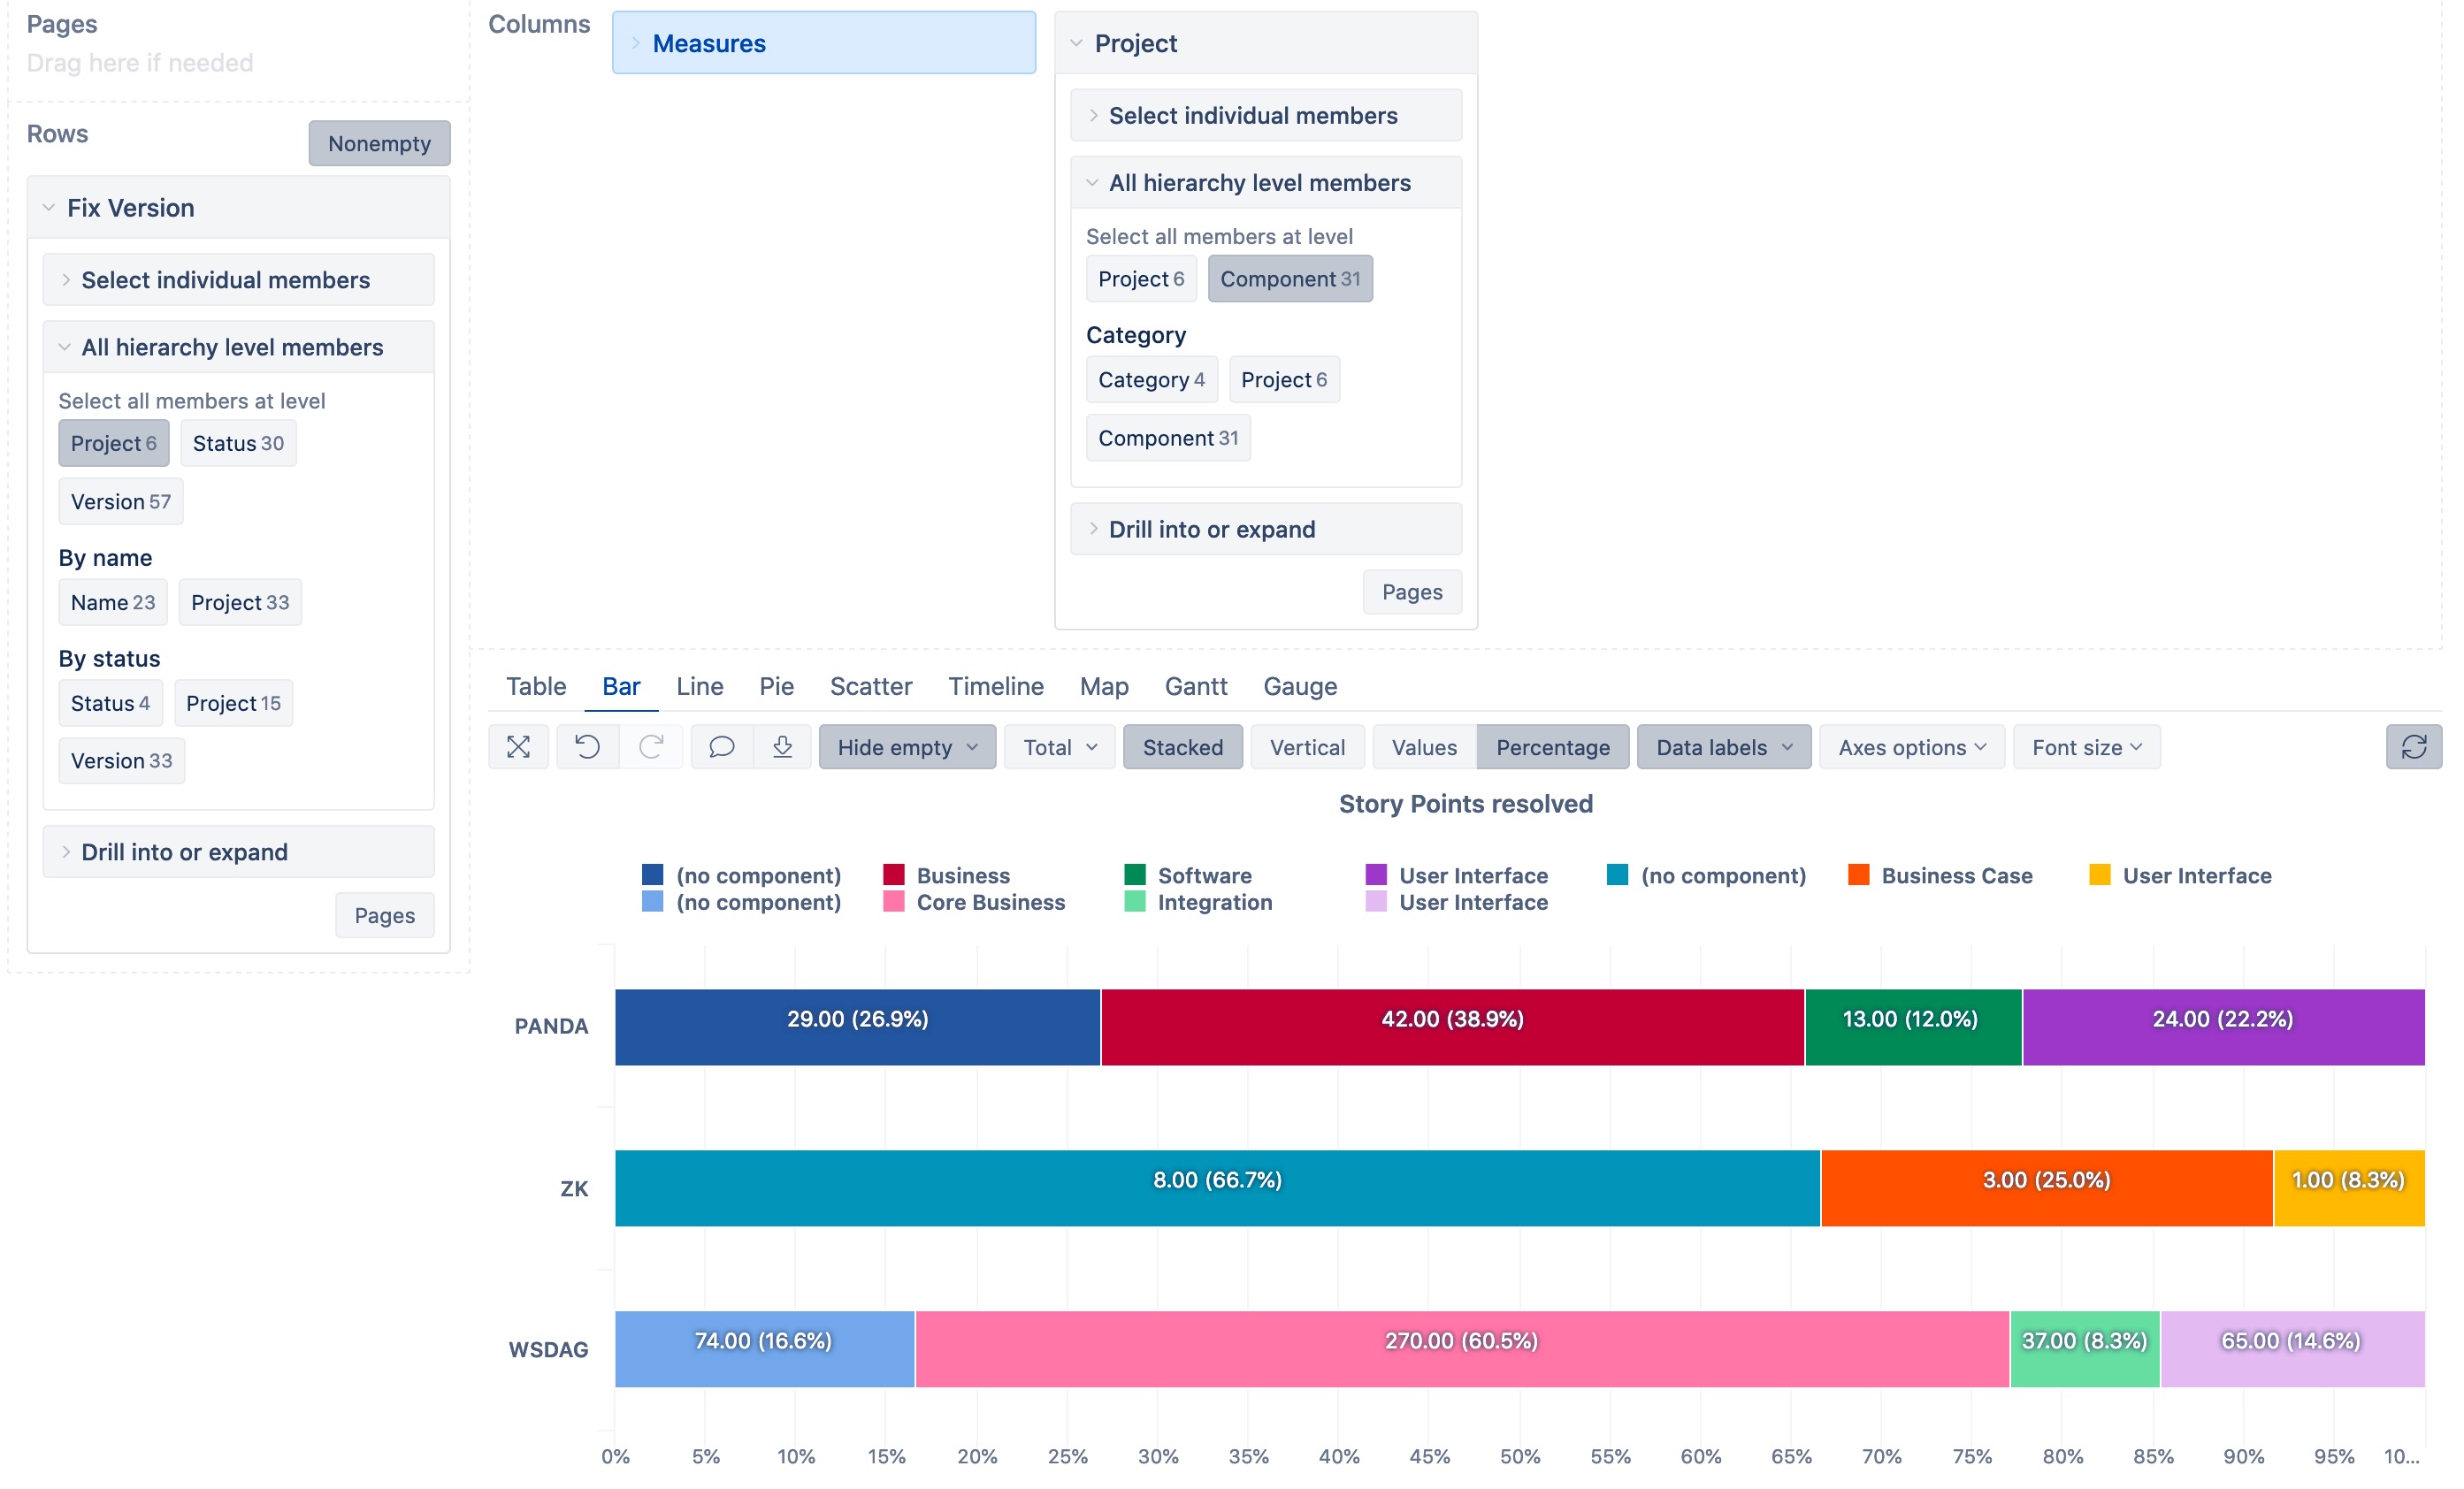
One option, you may use dimension “Fix Version” to represent projects as it has a hierarchy level “Project”. And dimension “Project” to represent component level. The report might look like this:
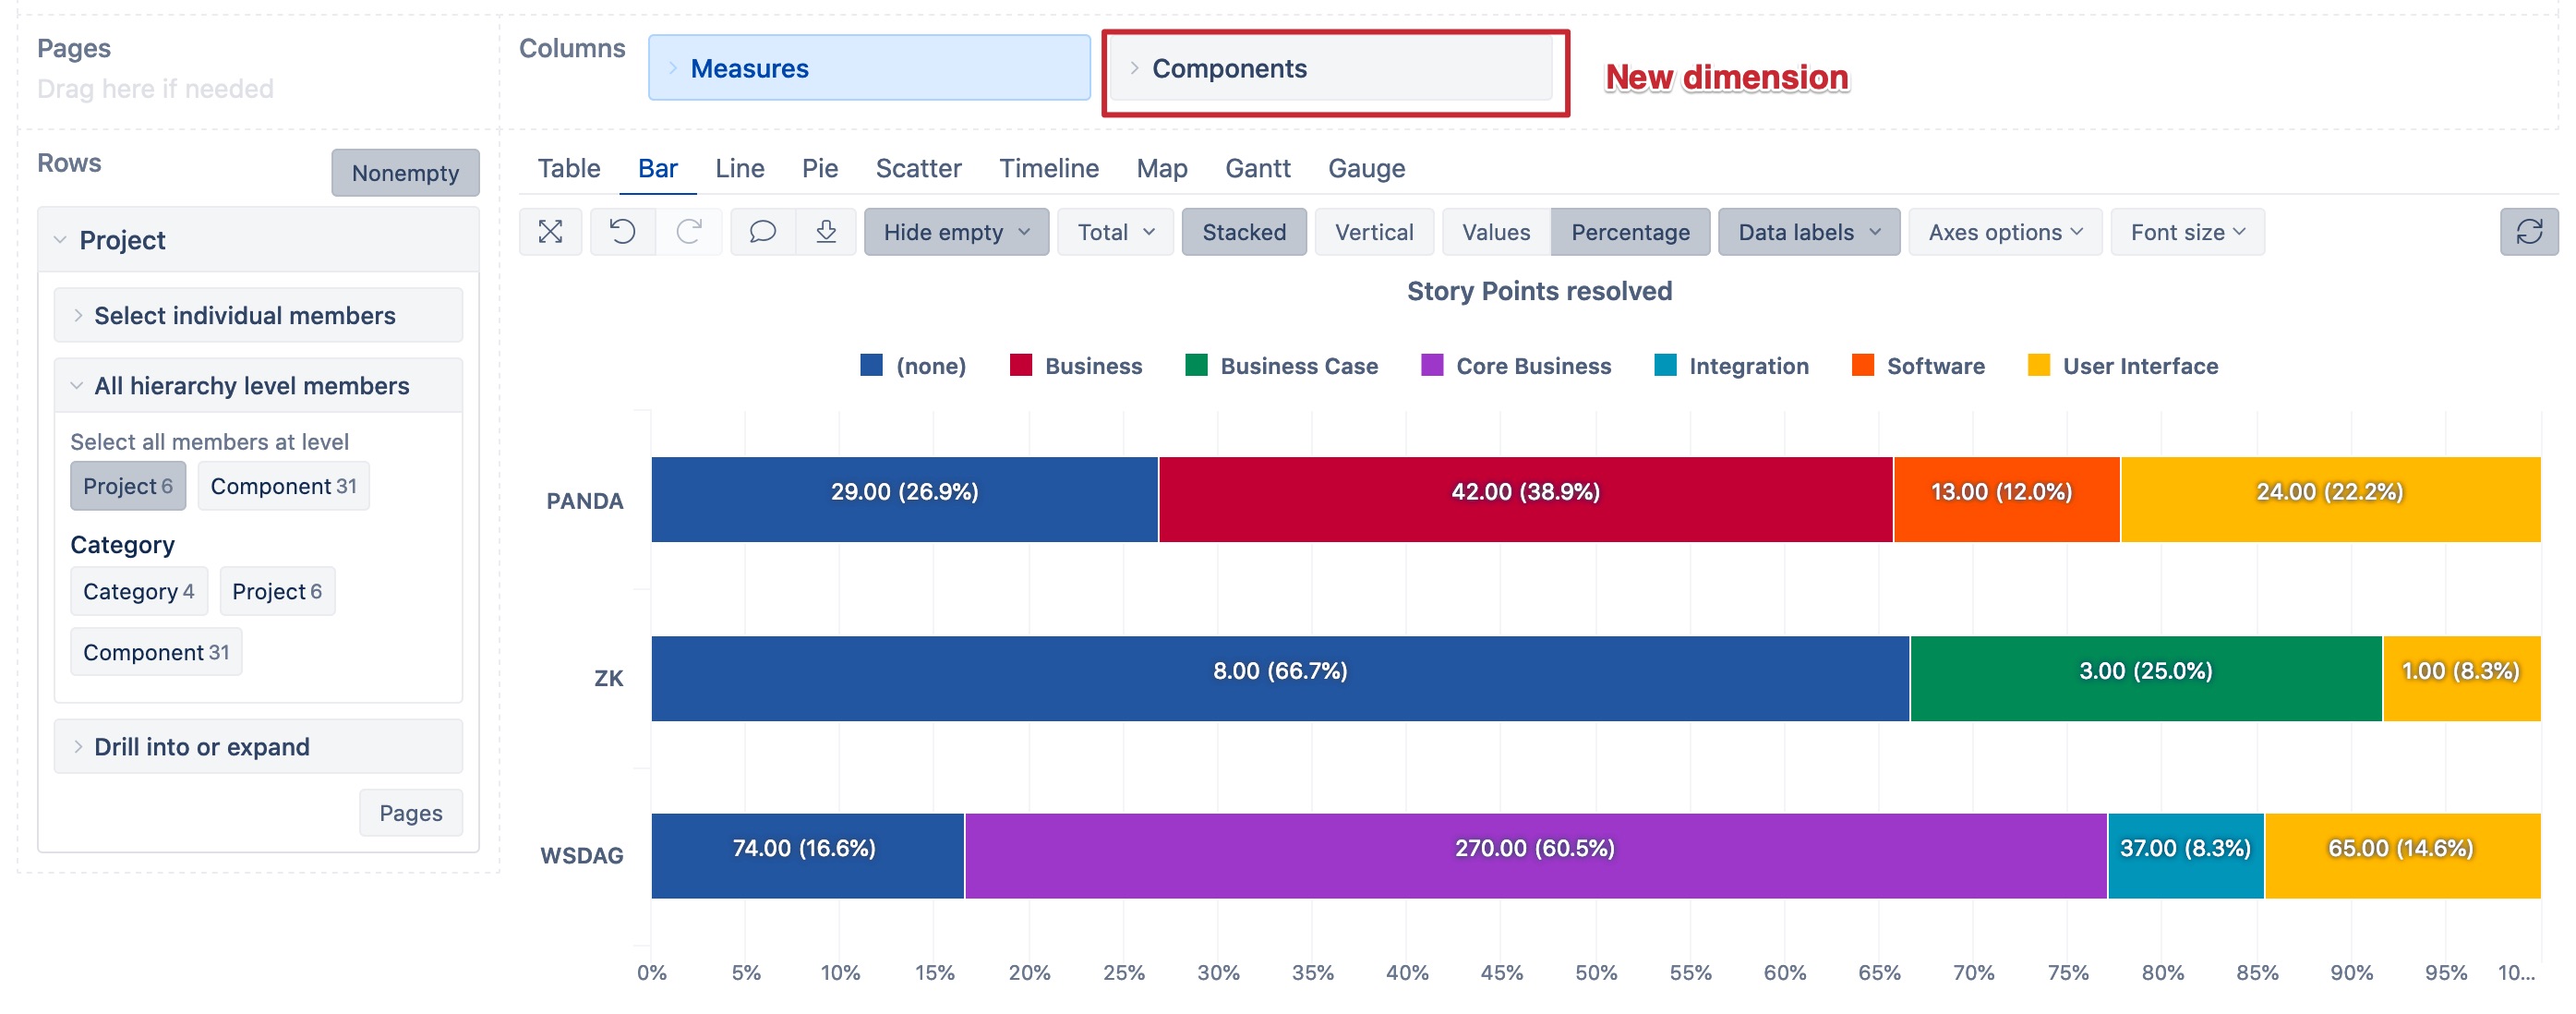
Another option. If you have components with the same name across multiple projects, then you might want to use another approach. Use dimension “Project” to represent projects and import Component values as a new dimension “Component”.
Then the report might look like this:
Please see this Community post on how to import Component as a separate dimension:
Best,
Zane / support@eazybi.com