Hello,
So, what I am needing to do is calculate the number of days an issue was closed before it went to deployment. I need the average number of days for all stories by the month they were released in. In other words, if I have 15 stories released in August…I need the average number of days those 15 stories were closed prior to the release. Any help would be greatly appreciated.
Thanks,
Hey @jchouinard,
I think the solution in this other question is what you are looking for: https://community.atlassian.com/t5/Jira-questions/EazyBI-Time-in-Status/qaq-p/231622
Hope this helps!
Jacques.
Hi Jacques,
Thank you for your response, however, I think my explanation for what I am looking for might not have been clear. What i need is the number of days difference of when a issue is closed to when is released. For example, if a story was closed on Oct 1, 2019 and the release date was Oct 8, 2019, I need a calculation to show me 7. I then need these to roll up, by month (of release) , as an average. Getting the "Closed Date is fairly straight forward, however getting the release date seems a bit more challenging. We may have 20 stories that are released on the same day.
Thanks,
Hi @jchouinard,
If by releasing an issue, it is transitioned to another status, you can try to calculate the number of average days the issues have spent in the status “Closed” with the calculation below:
([Measures].[Average days in transition status],
[Transition Status].[Closed])
If this is not the case, please provide more information from where you determine the “Release date”.
Best,
Roberts // eazyBI support
Hi Roberts,
The “Release Date” is found in the Fix Version dimension, it’s not related to a status change. I have included some screen shots below.
This is how I get the release date: 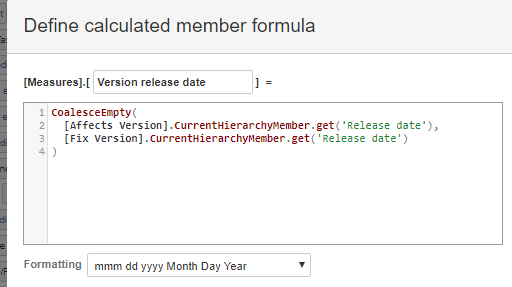 .
.
As shown below, there may be several stories in one release (batch size is counting the stories in that release: 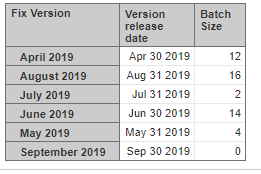 .
.
Here is the code for batch size: 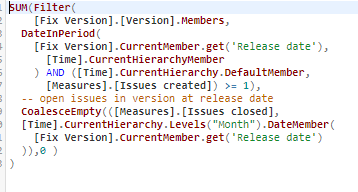
What i need is the release date of the story minus closed date of the story. I need this to be rolled up by the month the story was released. For example, if story xyz was closed on Apr 25 and released on April 30th, I need the calculation to show me the 5 days the story sat completed before being released. I hope this helps.
Thanks,
@jchouinard
In that case, you can try to create a new calculated measure with the AVG() function. Please have a look at the code below:
AVG(
  Filter(
    Descendants([Issue].CurrentHierarchyMember, [Issue].[Issue]),
    NOT IsEmpty([Measures].[Issue closed date])
    AND
    [Measures].[Issues closed] > 0
  ),
  DateDiffDays(
    [Measures].[Issue closed date],
    [Measures].[Version release date]
  )
)
This will create a set of closed issues for each Fix Version dimension member on rows. Then the set will be evaluated over the sum of days all the issues spent in “Wait time” - days between the closed date and the version release date.
Are you using the Time dimension in the pages of the report? It may be you have to adjust the conditions in the Filter() section if so.
Best,
Roberts // eazyBI support