Hi @jvdh.vidaxl and @aalex,
To get the number of issues created AND resolved in the period currently on the Time dimension, it is necessary to create a calculated measure that would iterate through all the issues. This could create a performance hit, resulting in the report time-outing. Especially if there are three of those in one report.
Before you try the calculated measure mentioned above, please try to create a tuple of the measure “Issues created” and the Resolution dimension member that defines the desired resolution (resolved, done, etc.). Please have a look at the example below:
([Measures].[Issues created],
[Resolution].[Done])
In combination with the Time dimension in the report, this calculated measure would display the resolved issues to the period the issues were created. The drawback - it doesn’t give any indication on when the issues were resolved.
You could try to do the same with the measure “Story points created”.
For the “Average resolution workdays”, there is no other option than creating a calculated measure that will iterate through all the issues. Please have a look at the formula below:
AVG(
  Filter(
    Descendants([Issue].CurrentHierarchyMember,[Issue].[Issue]),
    DateInPeriod([Measures].[Issue created date],[Time].CurrentHierarchyMember)
    AND
    DateInPeriod([Measures].[Issue resolution date],[Time].CurrentHierarchyMember)
  ), [Measures].[Total resolution workdays]
)
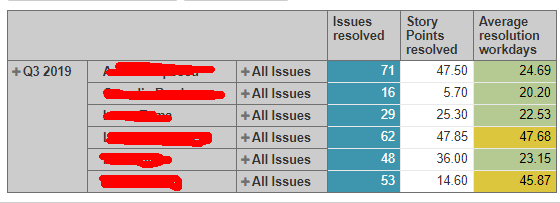
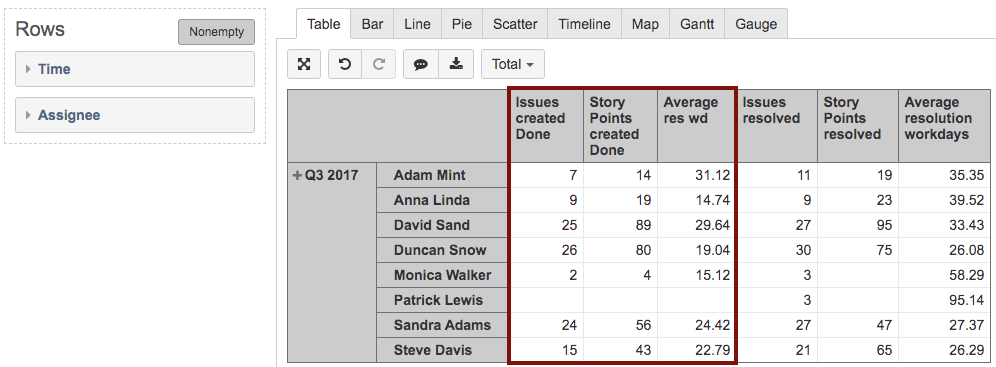
Please have a look at a picture of a sample report below where you can compare the results for the calculated measures and the default ones:
Please have a look at the eazyBI documentation page for more information on calculated measures - https://docs.eazybi.com/eazybijira/analyze-and-visualize/calculated-measures-and-members/calculated-measures.
Best,
Roberts // eazyBI support