Thanks in advance for any help!
My issue is that I want to calculate a rolling average for future dates.
At present we use eazyBI to measure team capacity commitments. This involves calculating an individual’s story points with due date and simply dividing it by the story point budget for the time period (we don’t work in sprints). Which is fine, as I have the time measurements rolling to the next 7 days or 14 days etc.
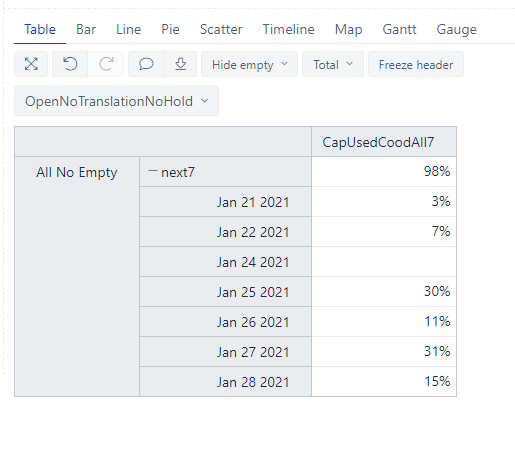
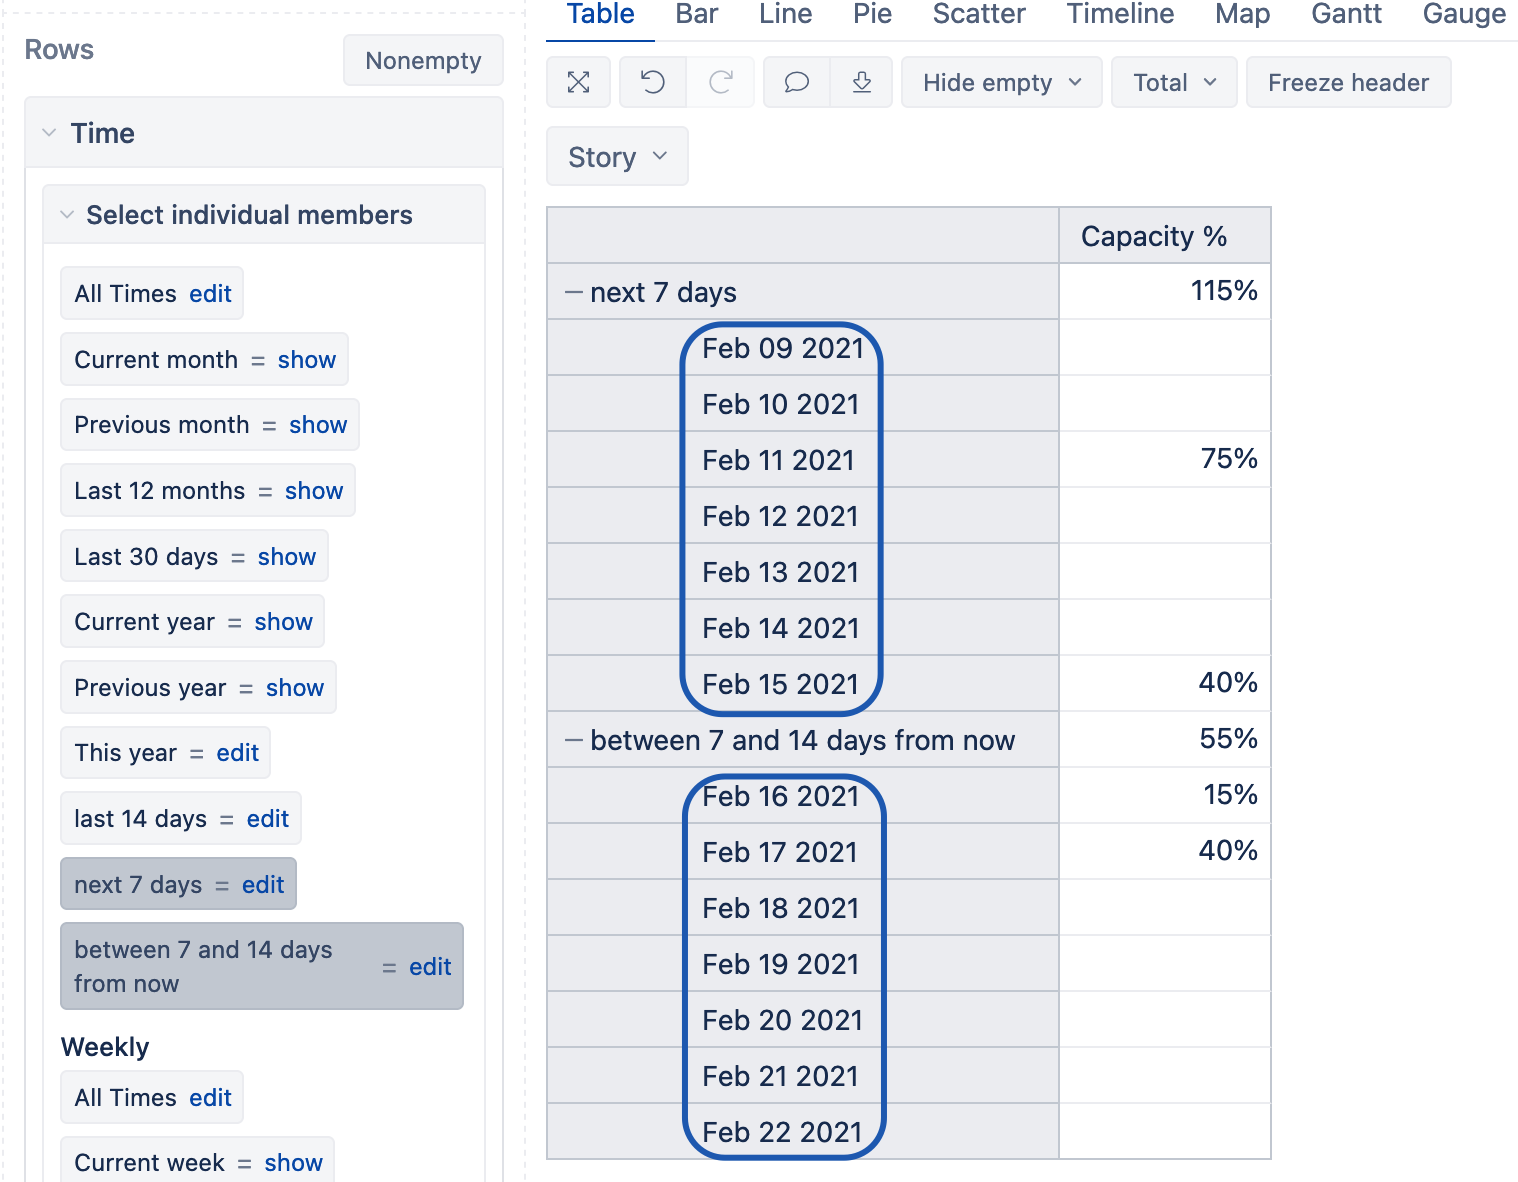
However, the big downside of the calculation above is that it tells us this person is at 98% capacity as of now, but doesn’t tell us when they’re next going to be under a threshold (let’s say 80%) for a rolling 7-day average and hence could take on more work. Ideally I could build a table similar to the above, but which reports for each day in the future what the 7 days after that looks like for capacity, and hence I could see the next date they would be free to work on a new issue.
I think conceptually this should be possible, I just can’t wrap my head around it, despite the excellent examples of rolling averages in the past found here.
Thanks!