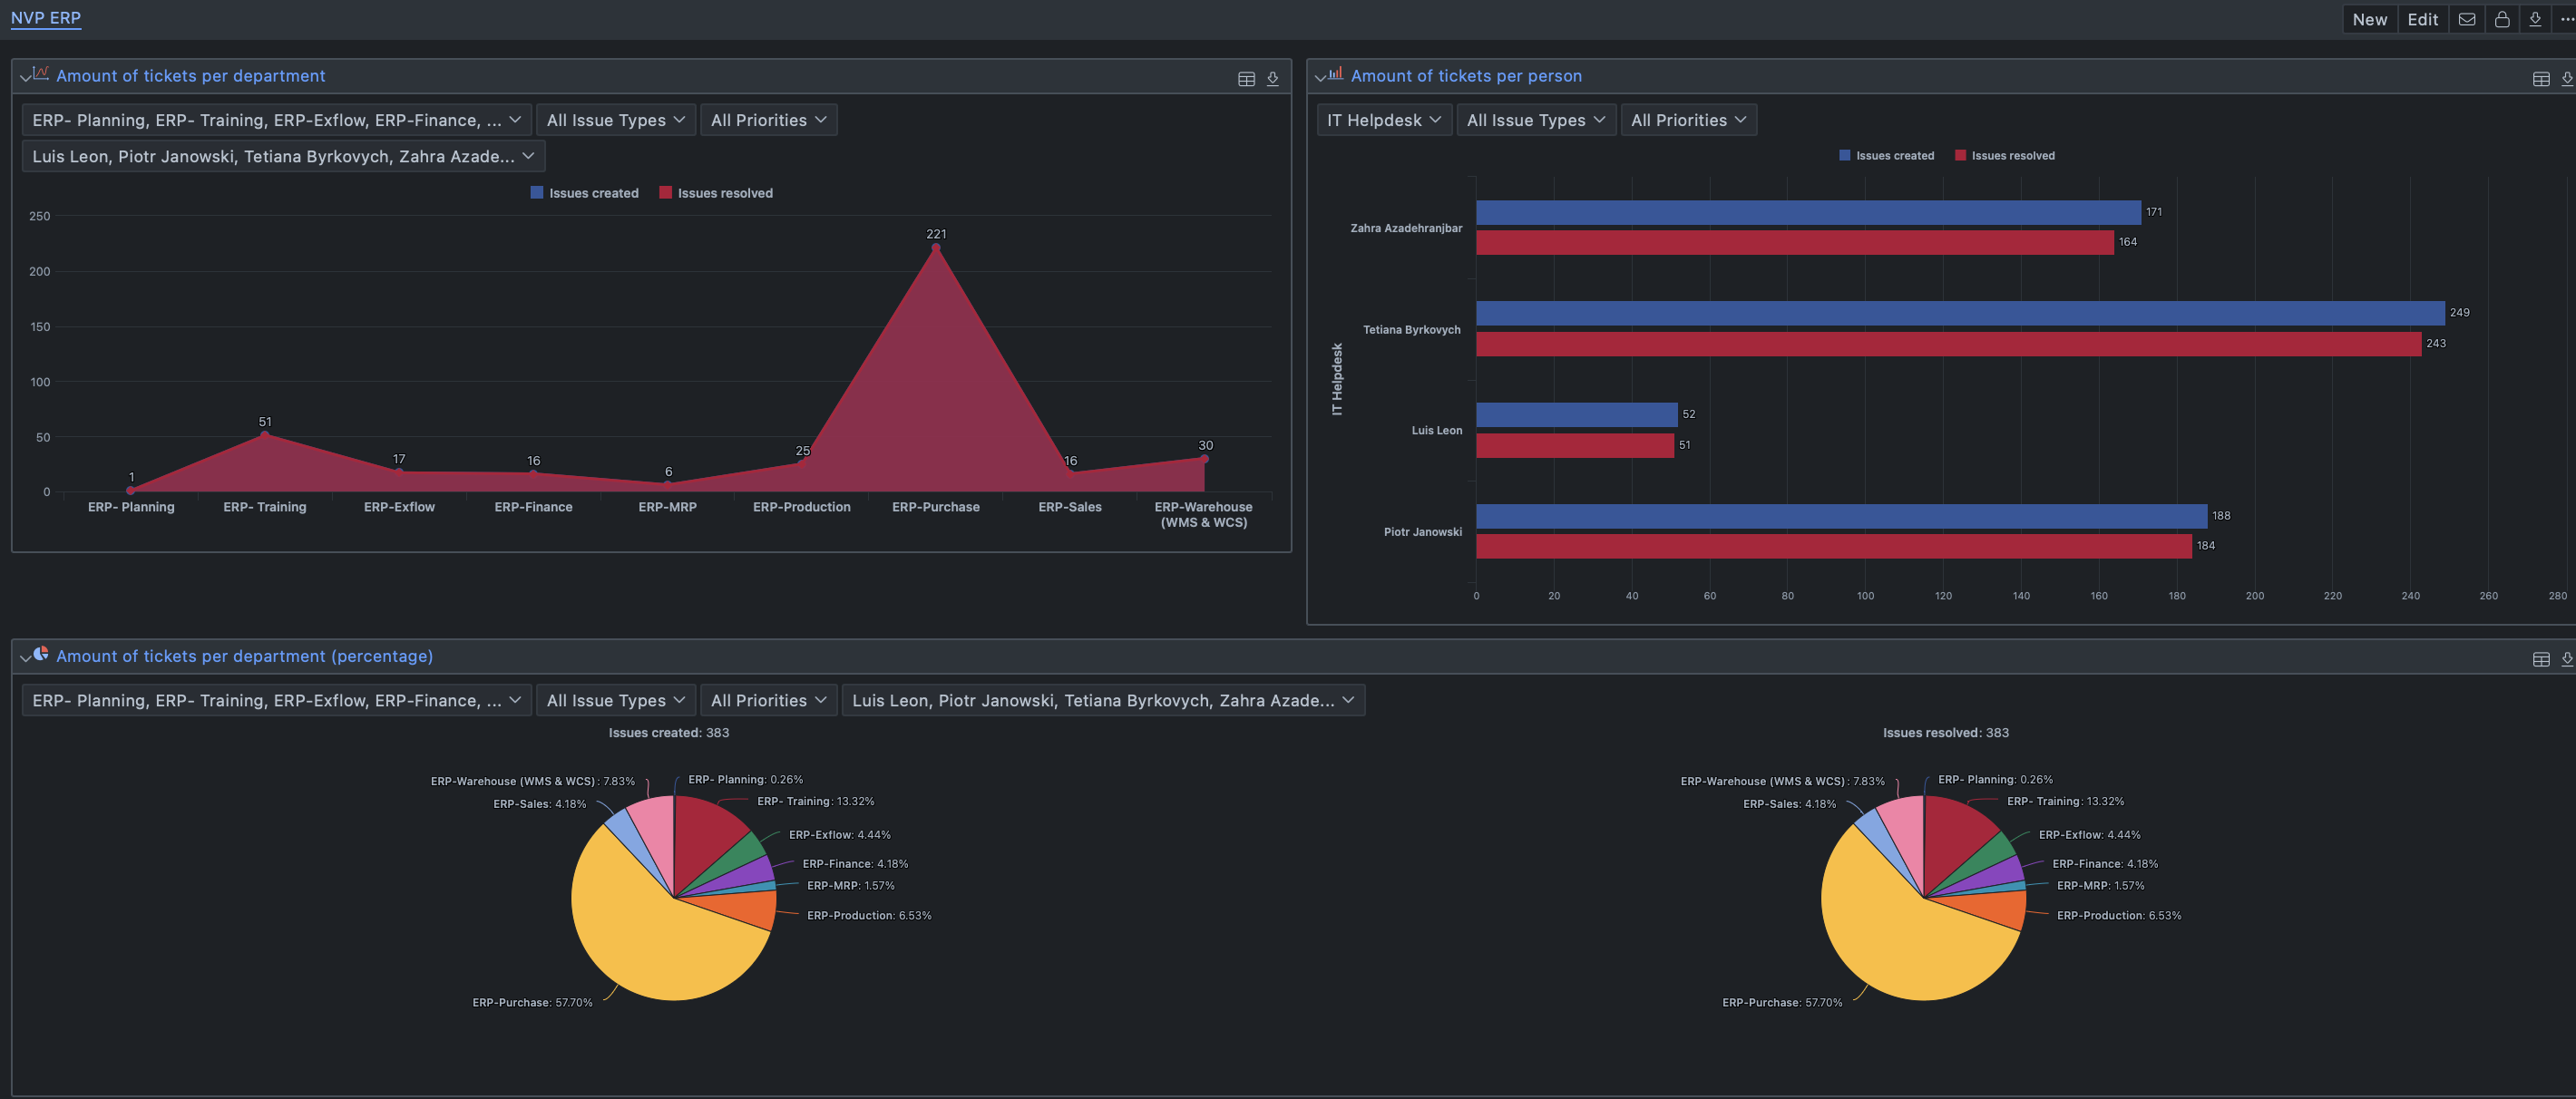
Hi, I prepared unique dashboard which represents all Jira activities of my team.
Each team-member works on Incidents/Service requests as part of IT Help desk in Jira.
Incidents and Service requests are divided per ‘label’ and ‘component’ according to a specific stream.
So, I collected all the data from Jira using Easy BI in order to create a dashboard which shows each team member loading, stream loading and SLA’s in the exact and percentage value.
Dimensions are used: [component], [label], [assignee], [issue type], [project]: