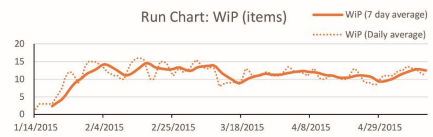
How can I calculate in the same chart with two lines for WIP with 7-day average and daily average?
Like this image:
How can I calculate in the same chart with two lines for WIP with 7-day average and daily average?
Like this image:
I’m not sure I understand what is the daily average displayed at the day level in the chart.
Perhaps you can explain that with an example.
Let’s say there are two issues (ABC-1, ABC-2) in status “In Progress” at the end of Sep 12 2023. What would be the daily your expected “WIP (Daily average)” result on that day for this scenario?
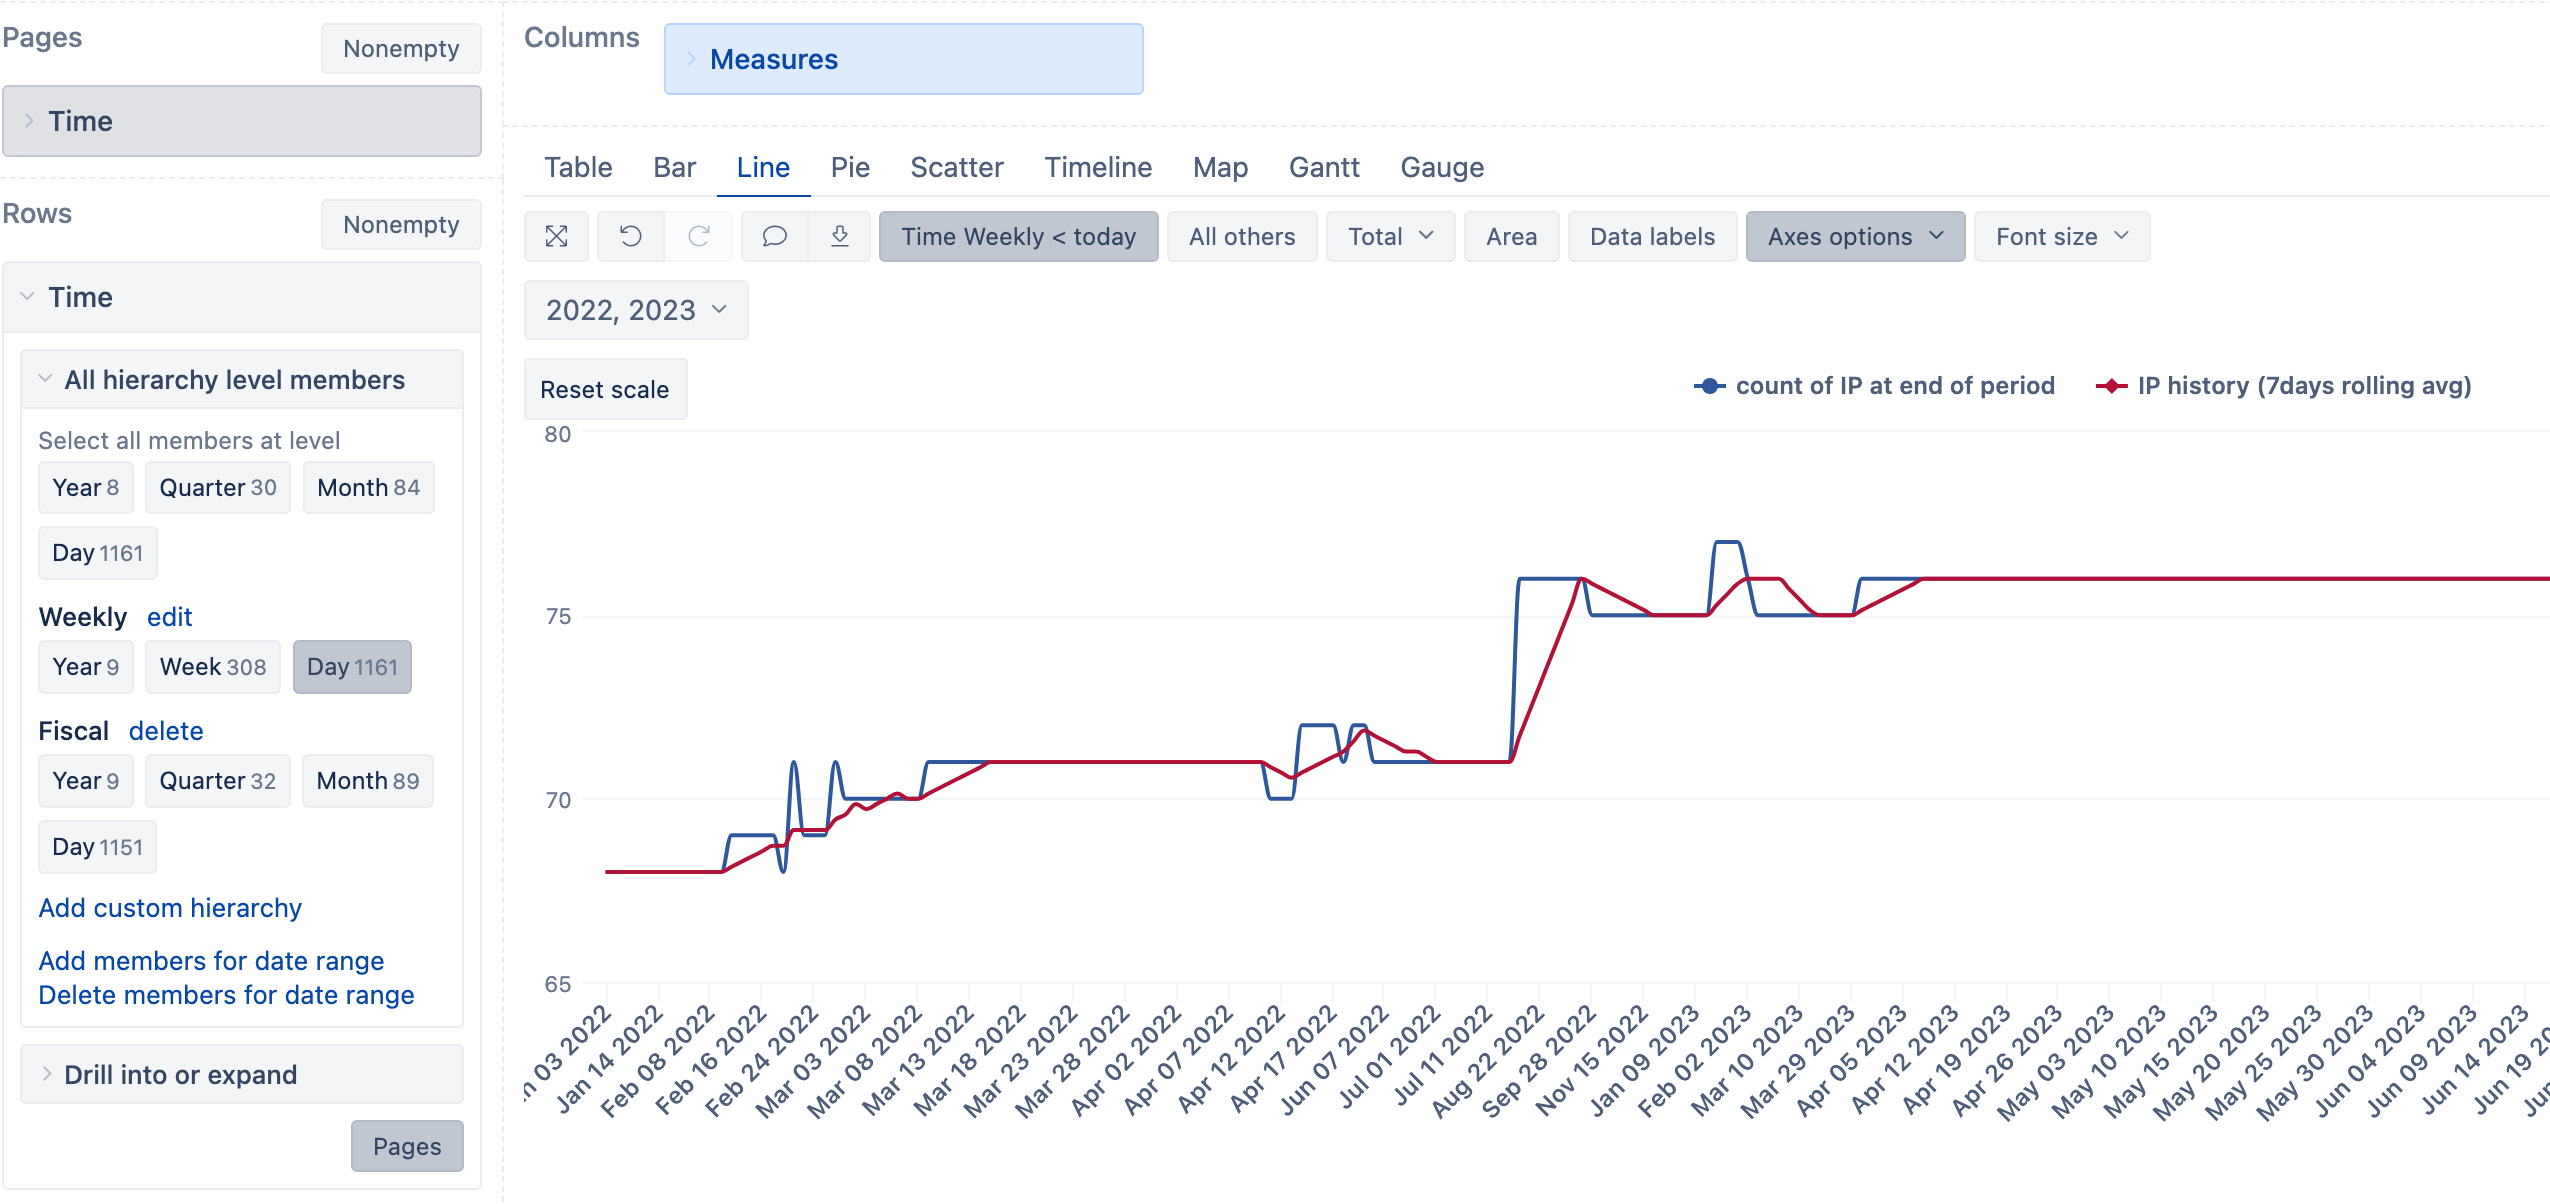
Anyway, you can try creating two new calculated measures:
“WIP (history)”
  (
    [Measures].[Issues history],
    [Transition Status].[In Progress]
  )
“WIP (7 day average history)”
Sum(
  {
  [Time].CurrentHierarchyMember.lag(6):
  [Time].CurrentHierarchyMember
  },
(
  [Measures].[Issues history],
  [Transition Status].[In Progress]
)
)
/
7
Here I’m assuming that WIP means work in progress, and it is represented by status “In Progress” in Jira.
Martins / eazyBI support
Thanks @martins.vanags it helped me a lot. The two measures solve my problem.
You´re right about WIP it means work in progress.
About daily average it could be complex or simple like an example:
(PROJECT 1, PROJECT 2) first have 10 issues in progress and the second have 15. The average at the end of the day is 12.5 issues.