Hi,
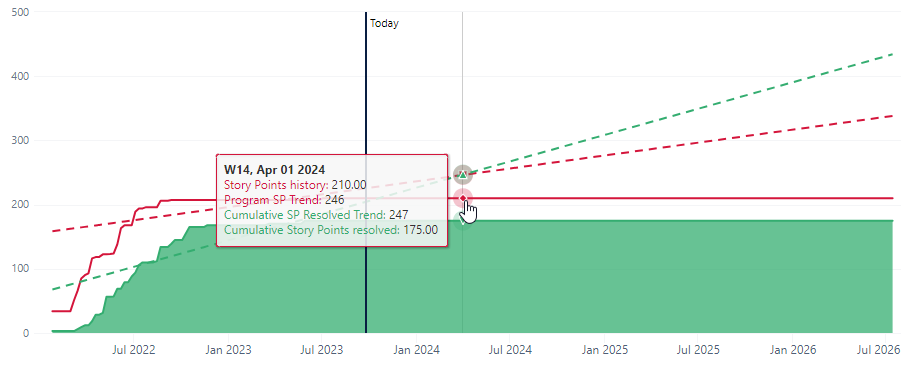
I’m working on a forecasting chart that draws trend lines for total ticket count and total tickets resolved.
Is there a way to create a calculated measure / member that returns the date the two dashed lines intercept so I can add a vertical line on the chart on that date?
Thanks,
Andrew.
Hi @a_frayling,
When both lines intersect and have equal values at the beginning of a Time dimension member, it might be easier. However, in practice, that seldom happens.
The calculation should evaluate that the difference between the lines was negative in the previous row and is not negative now.
The standard MDX would require calculating values of the measures for the previous Time dimension member and this one and then comparing.
The function PreviousRowValue() that is specific to eazyBI helps with that.
Please read more about this function here - PreviousRowValue().
The expression to find the intersection might be as follows.
CASE WHEN
--difference between measures was negative for the previous row
PreviousrowValue(
[Measures].[Cumulative SP Resolved Trend] - [Measures].[Program SP Trend]
) <0
AND
--difference between measures is not negative for this row
([Measures].[Cumulative SP Resolved Trend] - [Measures].[Program SP Trend]) >=0
THEN
--something to display as label for intersection
 [Time].CurrentHierarchyMember.StartDate
END
You might add this measure to the report and select to display as a chart type - vertical line.
Regards,
Oskars / support@eazyBI.com
Thanks @oskars.laganovskis that’s exactly what I was looking for.