Hello!
I’m here again asking for help.
This time I’m trying to create a table to show a trend with a simple green/red arrow. This trend has to be calculated out of a comparison between the data on that current row vs the one on top of it.
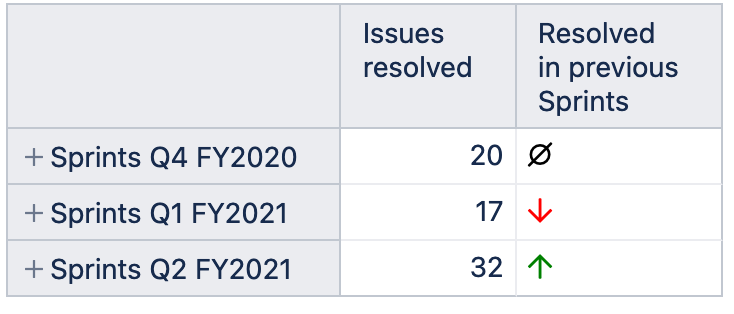
Current situation:
I would like it to be:
Trend on first row: empty
Trend on second row: red
Trend on third row: green
Trend on fourth row: green
All this has to be dependent on what’s currently there in the table. But I have no clue on how to build a measure like that (or if it’s possible at all)
Hello again! I was able to pull off the trend that I was looking for using
[Time].CurrentHierarchyMember
and
[Time].CurrentHierarchyMember.PrevMember
I’m having a different issue now:
I created these calculated members inside the Sprint dimension:
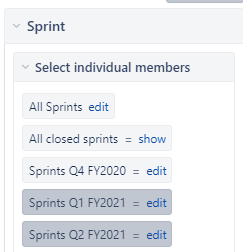
And I have to create the same trend with previous sprints (can’t use the Time dimension now because of weird sprint dates).
How can I compare different members so the trend gets created dynamically?
Hi @Lucas_Laroz!
Great that you found the correct solution for the Time previous member!
For any other dimension, you can use the VisibleRowsSet() function to find the previous of the row members.
Note that I have added an empty set for the first member. Here is the formula for the above:
CASE WHEN
Rank(
  [Sprint].CurrentHierarchyMember,
  VisibleRowsSet()
) = 1
THEN "<i class='far fa-empty-set' style='color:black'></i>"
ELSE
CASE WHEN
  [Measures].[Issues resolved] >
  Sum(Tail(Head(
    Cache(VisibleRowsSet()),
    Rank([Sprint].CurrentHierarchyMember,
      Cache(VisibleRowsSet())
    ) - 1
  )), [Measures].[Issues resolved])
THEN
"<i class='far fa-arrow-up' style='color:green'></i>"
ELSE
"<i class='far fa-arrow-down' style='color:red'></i>"
END END
Note that the order in which you select the bookmarked members would be important in this approach.
Lauma / support@eazybi.com