I’m a new user of EazyBI and would need some help. I’m not familiar with all the terms, so try not to get confused if I’m using wrong ones in some cases ;D
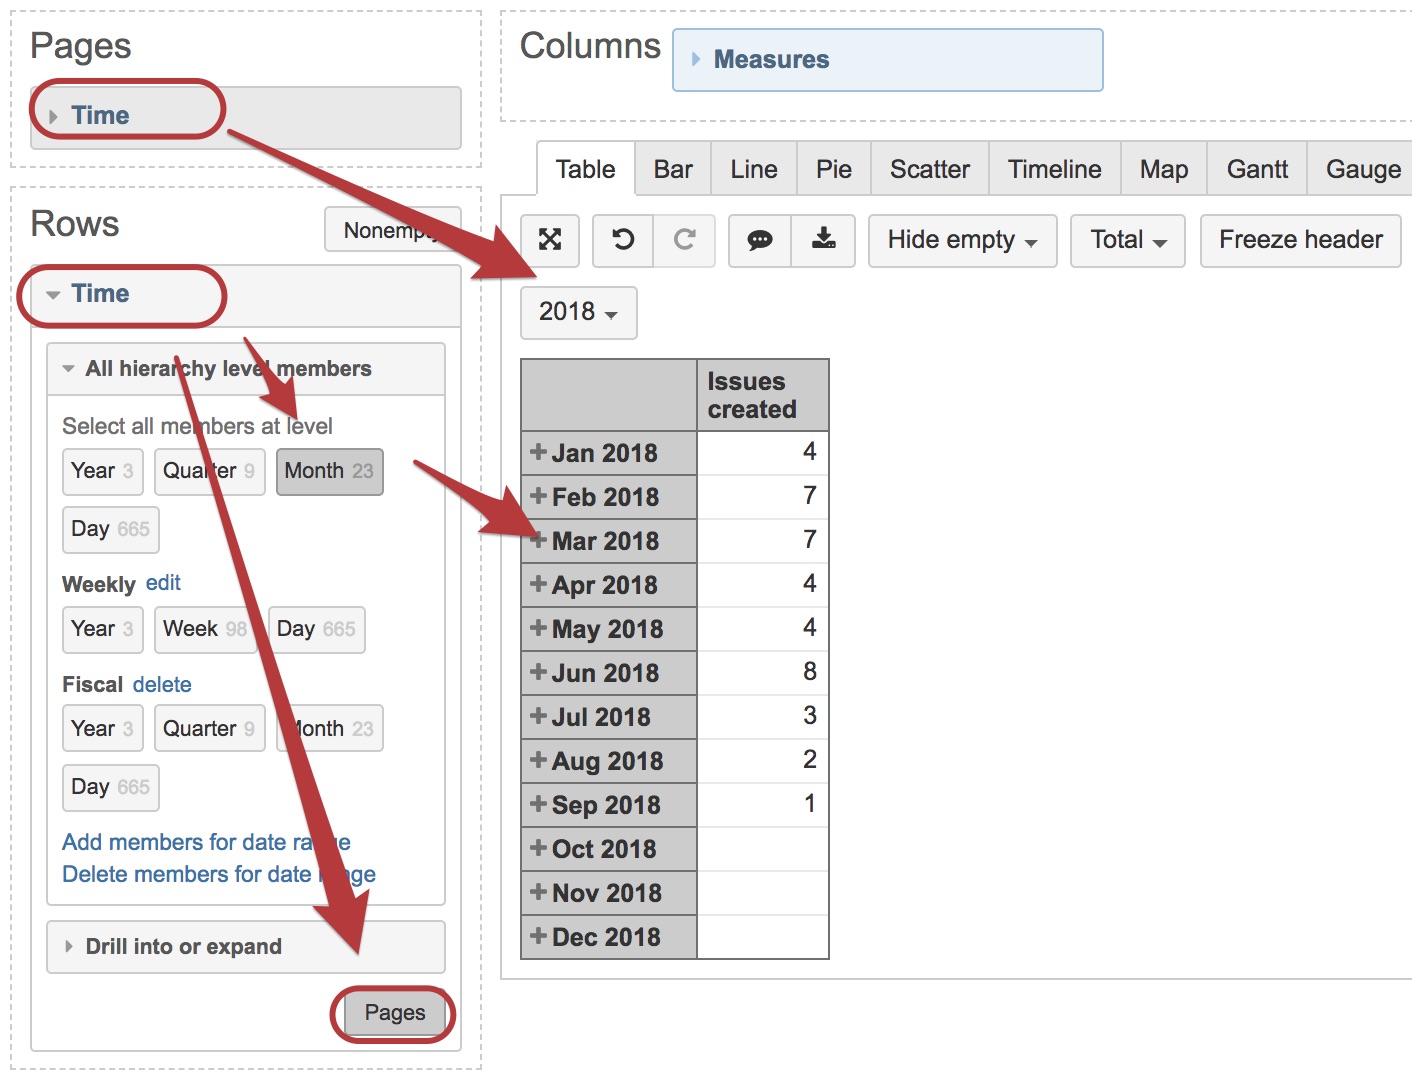
I’m trying to create line graph, which shows all costs within a current year. Infact, I’ve already managed to done it. However, I would like to know, if I could improve it so I don’t need to modify it later that much. I’m using time filter in graph setup to show only year 2018 and I’m filtering cost data using the calculated member below:
Is there any way to write calculated member, that uses same time filter than the graph? Is there some kind of variable that points to that filter? It would be the best option in case, where user wants to see costs in different timeline.
Hi Martins,
I want to compare the total requests delivered until last week (week 18) of this year (2020) and previous year (2019) i.e YTD comparison. How should I filter it that the condition get auto updated?
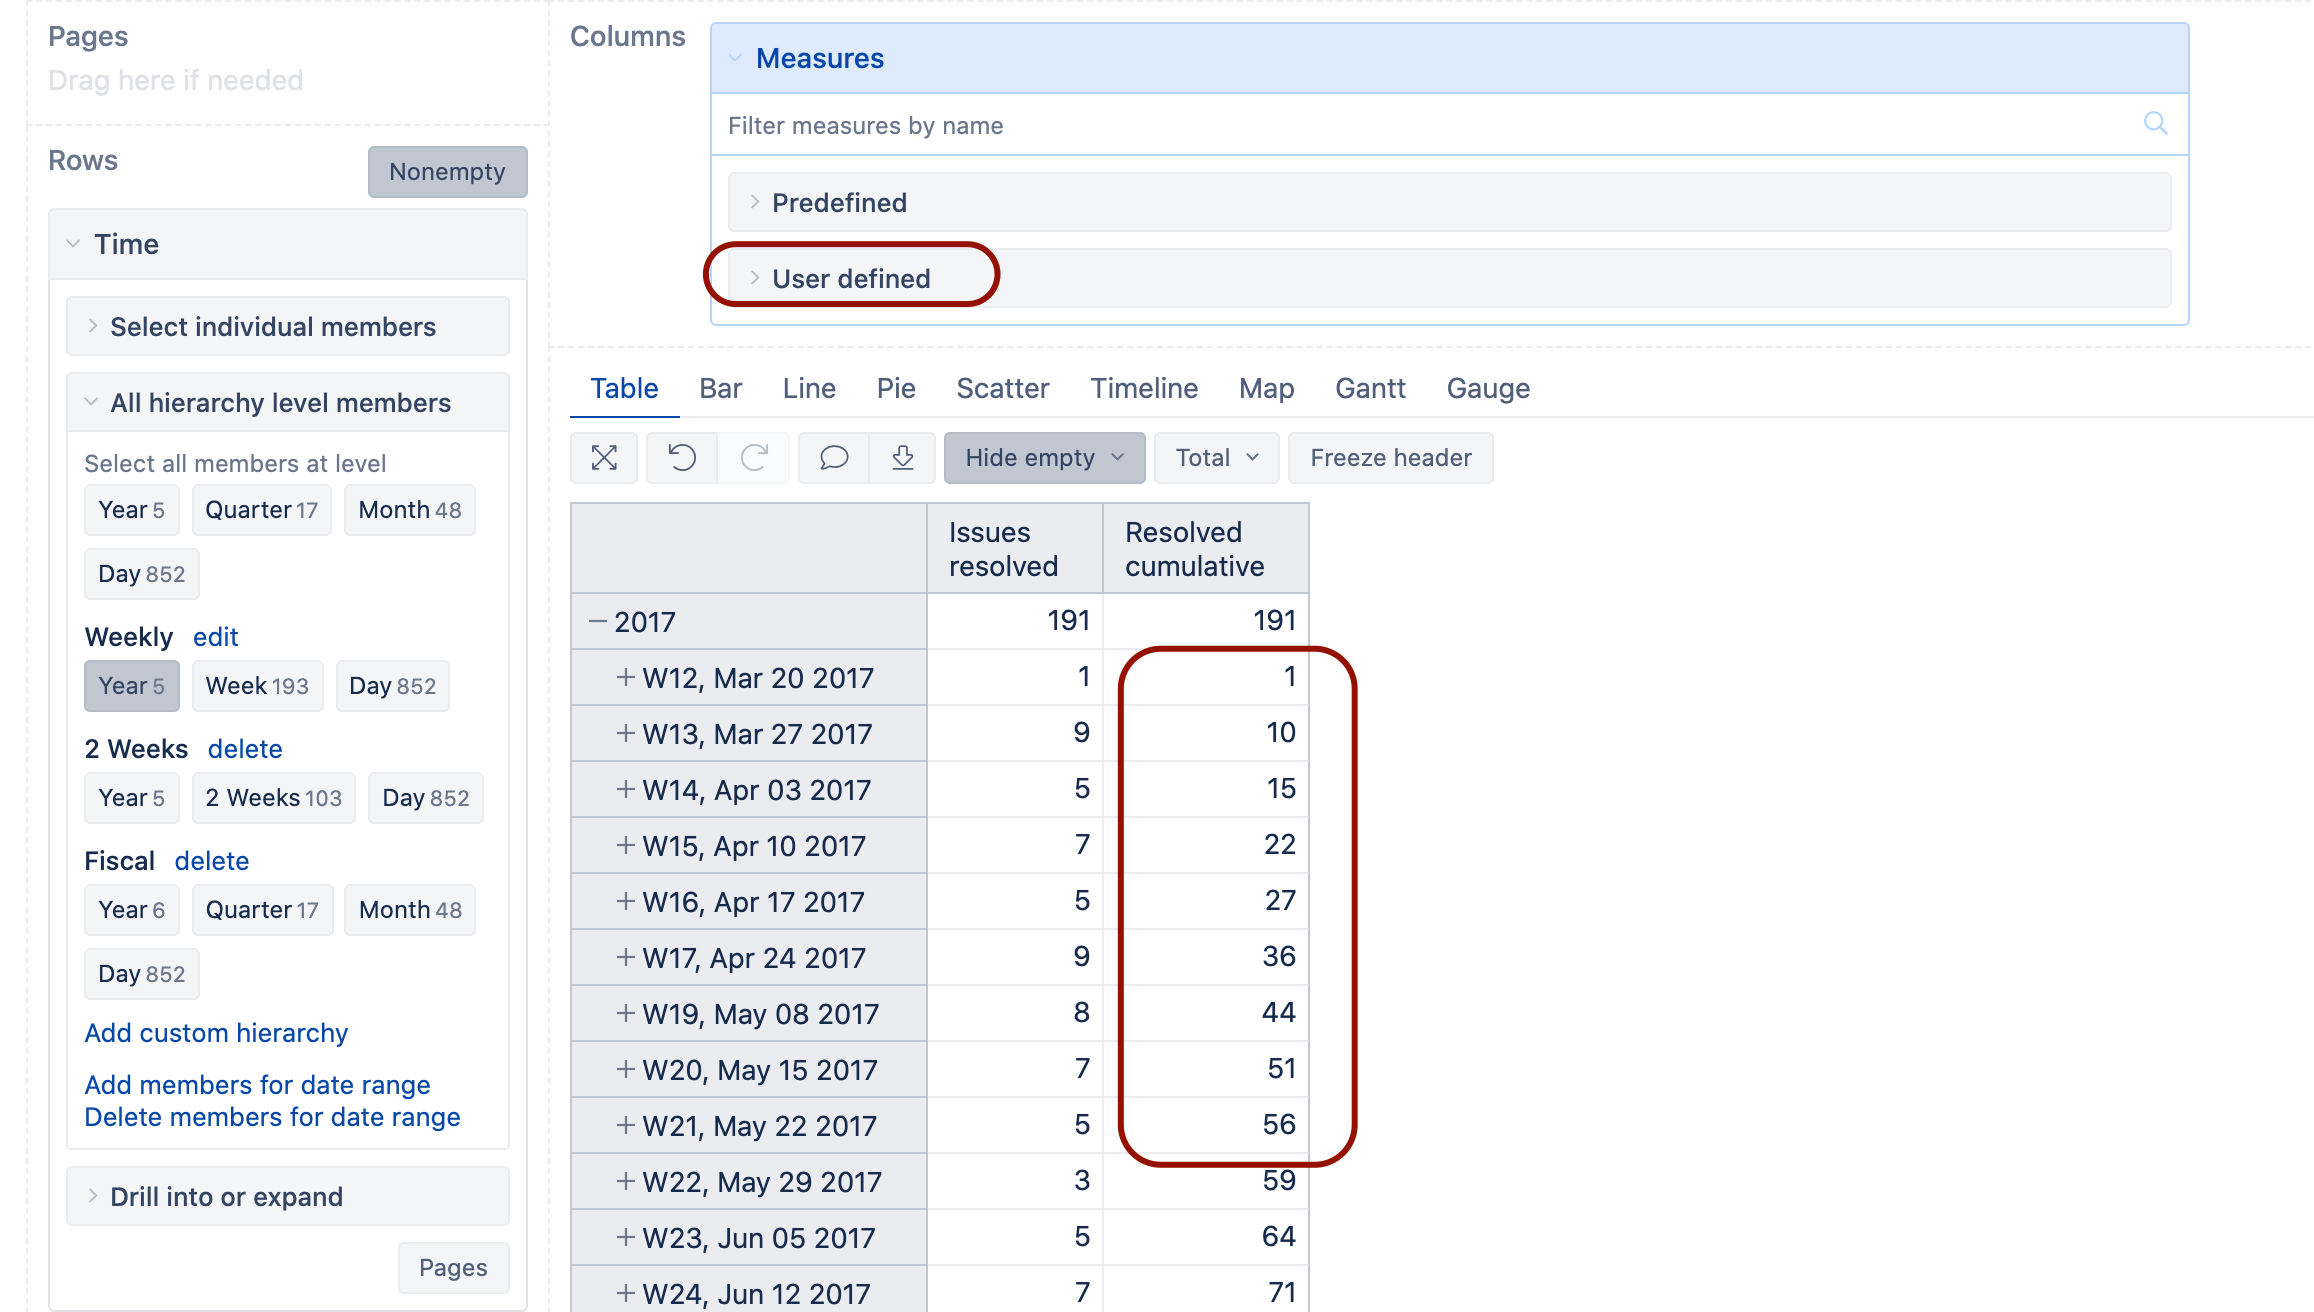
Thanks Martin, I explored YTD, ParallelPeriod and PreviouPeriods function in measure but unable to get my results. What I want is to compare how many issues were resolved until last week (i.e. week 18) in the year 2018, 2019 and 2020.
Similarly have to sum up a particular field until last week (week 18) for 2018, 2019 and 2020. Can we have a Week Number or Quarter filter at the page level which will cumulative calculate the values for respective years?
Try this formula to return cumulative issues resolved for weekly hierarchy.
CASE WHEN
[Time].CurrentHierarchy.Level.Name = "Week"
THEN
SUM({
[Time].CurrentHierarchy.Levels("Week").CurrentHierarchyMember.Parent.Children.item(0):
[Time].CurrentHierarchy.Levels("Week").CurrentHierarchyMember
},
[Measures].[Issues resolved])
WHEN
[Time].CurrentHierarchy.Level.Name = "Year"
OR
[Time].CurrentHierarchyMember is [Time].CurrentHierarchy.DefaultMember
THEN
Sum([Measures].[Issues resolved])
END
It would return the cumulative sum for week level members