Hi Team,
We are using “Issue” and “Fix-version” Dimension on Rows and “Measures” dimension on Columns. We have few calculated measures to do SPI and CPI calculation for each project.
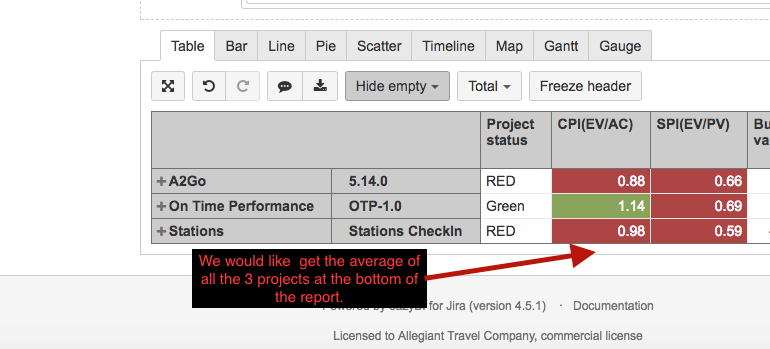
So we wanted to do the avg of all the rows and display it at the bottom. Is it possible with the current outline of the report (Please refer the attached screenshot)
?
Hi,
By default, “Total” function calculates the sum of values or does the calculation accordingly to the used measure. It shows the average only if the measure is calculating the average (for instance, the “Total” of “Average resolution days” would be the average of all rows).
If you need to get sums for detailed rows and average for the total, use “All level” member in the report rows (All Issues in your case) instead of standard Total to show the average. To achieve that, you may use CASE WHEN construction in the measure calculation. The structure of such a measure would be the following:
Case WHEN
 [Issue].CurrentHierarchyMember is [Issue].CurrentHierarchy.DefaultMember
THEN
  (Average calculation)
ELSE
  (Sum calculation)
END
Use the needed dimension in the calculation!
Remeber to leave All level member not removed to display the average value.
For assistance with your particular calculation, please, contact support@eazybi.com.
Ilze, eazyBI support