Hi everyone,
I’ve been learning EazyBI usage recently and gotten far thanks to the helpful docs and you guys on the forums.
I’ve finally hit a problem I can’t find a solution for.
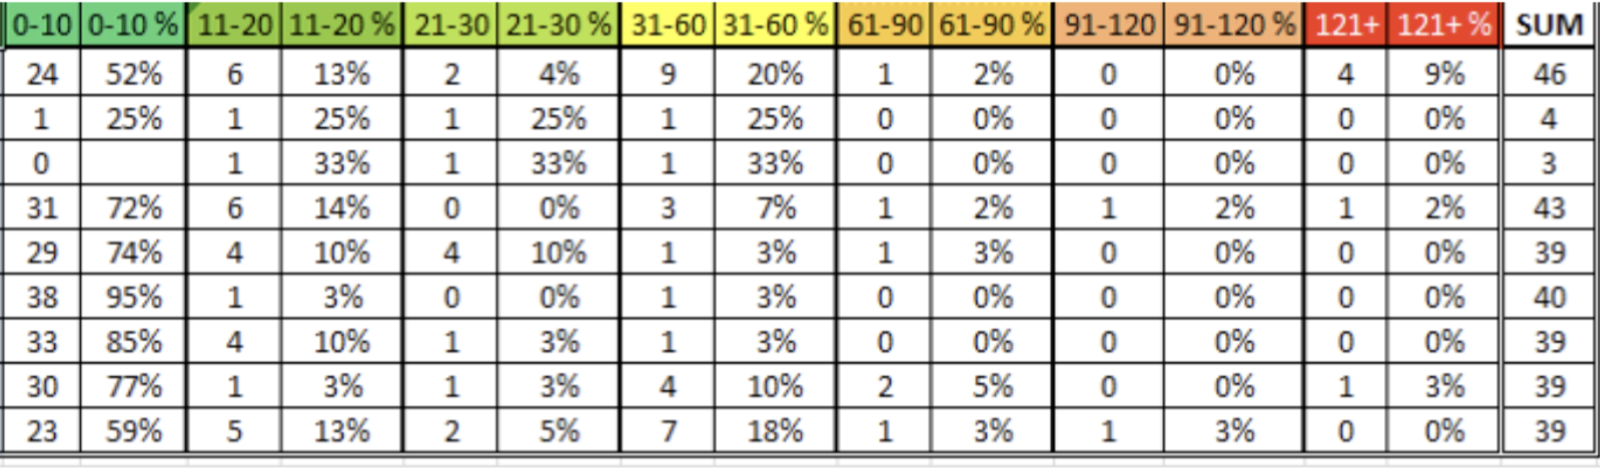
We want to track an issue’s age in intervals (0-9, 10-19, …) and see which status has how many issues. This was relatively easy to find thanks to importing Age Interval data, and using Status in the row dimension.
Next, I would like to add a layer that helps to understand the data better.
-
I want to see the sum of the number of issues in status “Open” on the right side of the table. This works with the “Total” function but you’ll see soon why it breaks.
-
I want to see how big of a percentage a single age interval contains of the total issue count in section “1)”.
-
When using the percentages inline, I don’t want the percentages to be counted towards the total of the row (which happens now)
Example: if there are 10 issues,
2 of them are 1 day old issues with the status open,
Row: “Open status” and Column: 0-9 days cell should contain the number 2, and along it the percentage 20%.
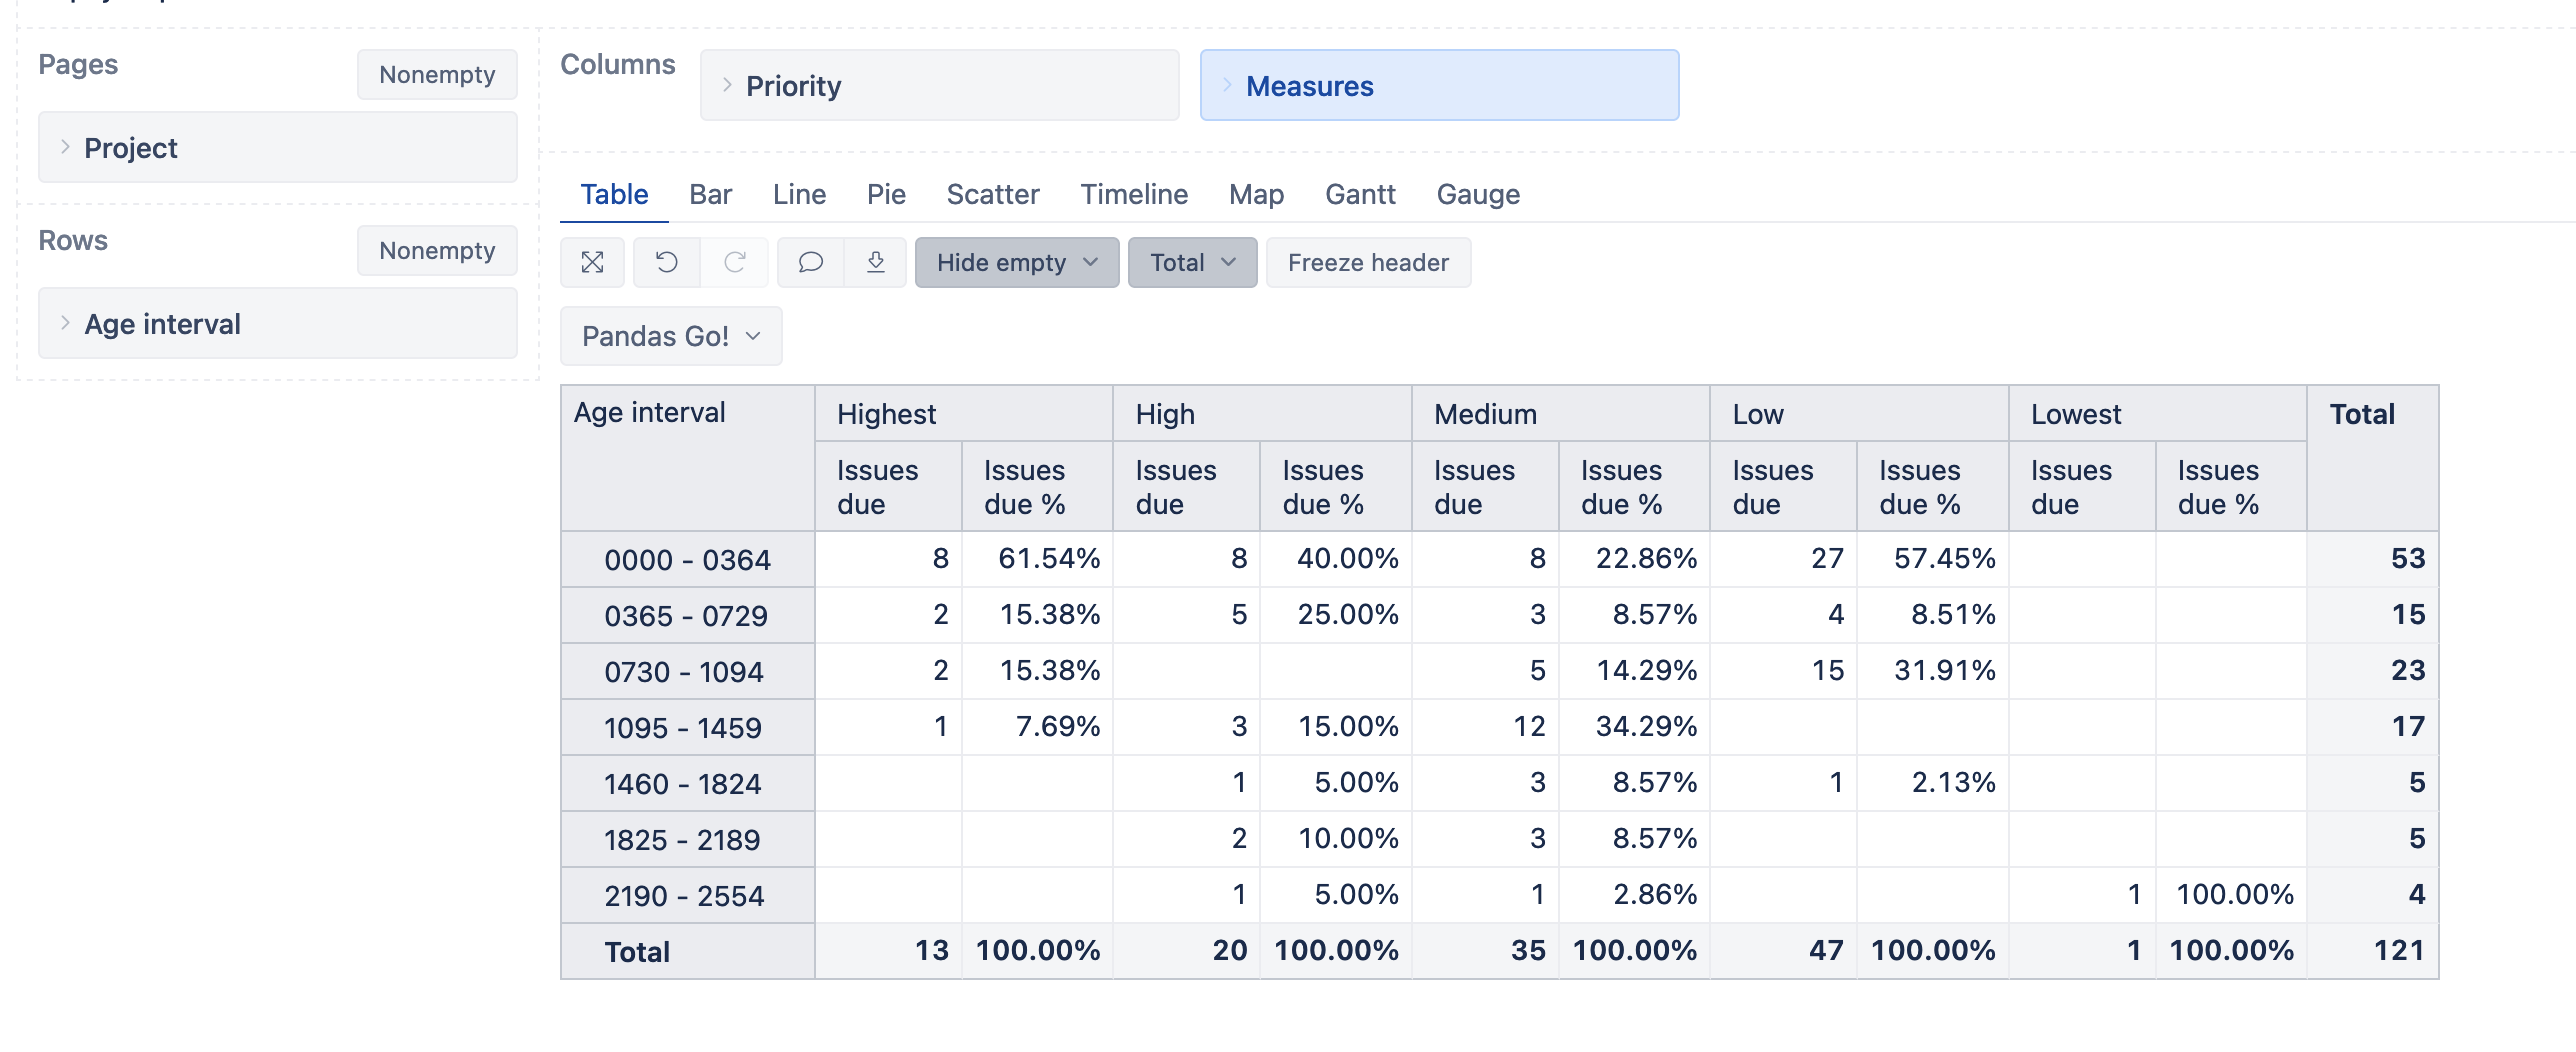
First image is how far I have gotten so far, I’ll see if I can attach a second image in a comment
By using the built in Total% calculation method, it only takes into account the number on its left, but not the “Total” at the end of the row, which I’d like it to take in to account. At the same time, all percentages affect the total, so I would need to edit the Total’s calculation method (perhaps by using $total_aggregate manipulation?).
So as a summary, I believe there are two actions I need help with:
A: can you help me write the MDX to create a calculated measure to find out in “Issue Created”, what is the share of the issues in that interval compared to all issues?
B: How do I edit the Total at the end of the row so that I can (potentially?) refer to it in the function in A?