is it possible to have a chart with a data table below it like you can do in Excel?
We have used Excel for reporting based on Jira exports in the past but now have access to eazyBI and would like to reproduce one report that uses a chart + data table setup.
In eazyBI reports, you can always switch between tabs: from the chart to the table and back. Data/structure are always the same for both.
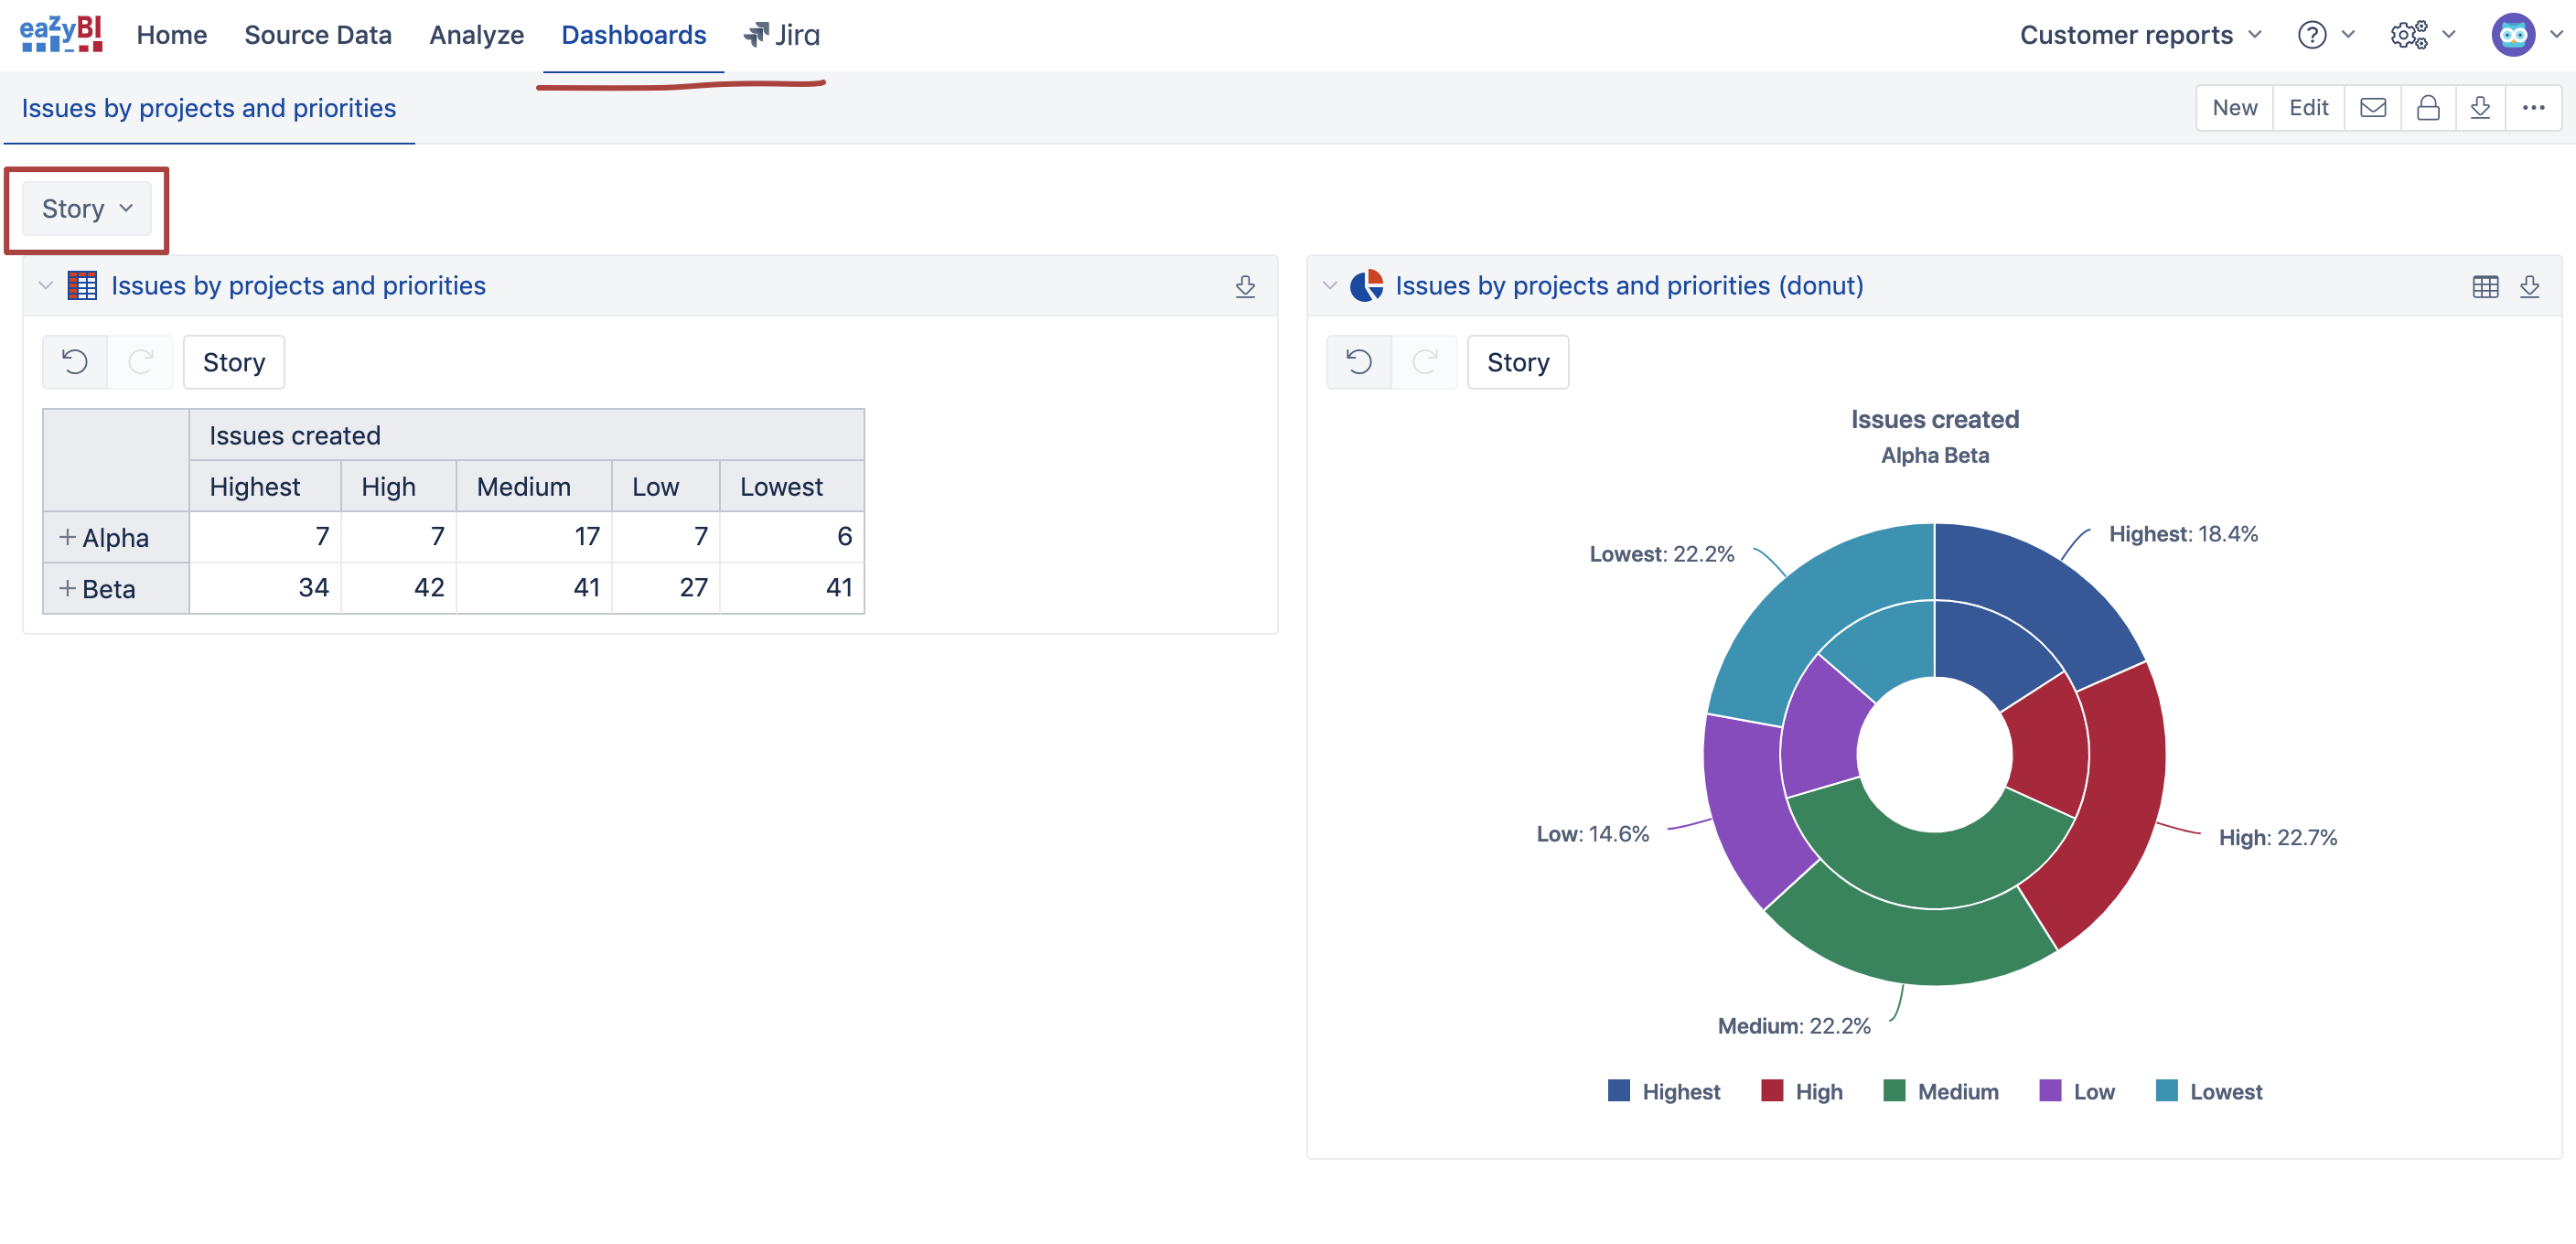
If you want to see both representations in one glance, you may use eazyBI dashboard: save two versions of the same report (one as a chart, another as a table) and place them side by side in the dashboard. If you have some dimensions in Pages, enable them as common page selection.
thanks for your suggestion. I had seen this option and it’s nice in general.
Unfortunately, it’s relatively inconvenient for us for a simple reason: you cannot see directly below the bar chart the data table with table columns aligned to the bar chart bar locations. Or would this be possible somehow?
PS: what you suggested with using two report copies would be much nicer from a report-admin perspective, if we did not have to save two reports just to get table + visualization. That’ll make two updates necessary every time we change something. It would be fantastic to have the option to save multiple visualizations of the data within the same report… or create something like a “linked copy” of a report where one copy is leading (i.e., you set up the data here + 1 visualization) and the other one is following it (i.e., you can only set up additional visualization here).