Hi,
I am very new to eazybi. Literally just started exploring yesterday. I am able to find videos where it can be used to Create charts and tables for jira data which is imported which contains information like Issues Created, Issues Resolved, Priority of Bugs and all. Also saw that it can take Data as Excel which should have columns/Fields as similar to Jira…like Key, Assignee, Created Date, Updated Date etc.
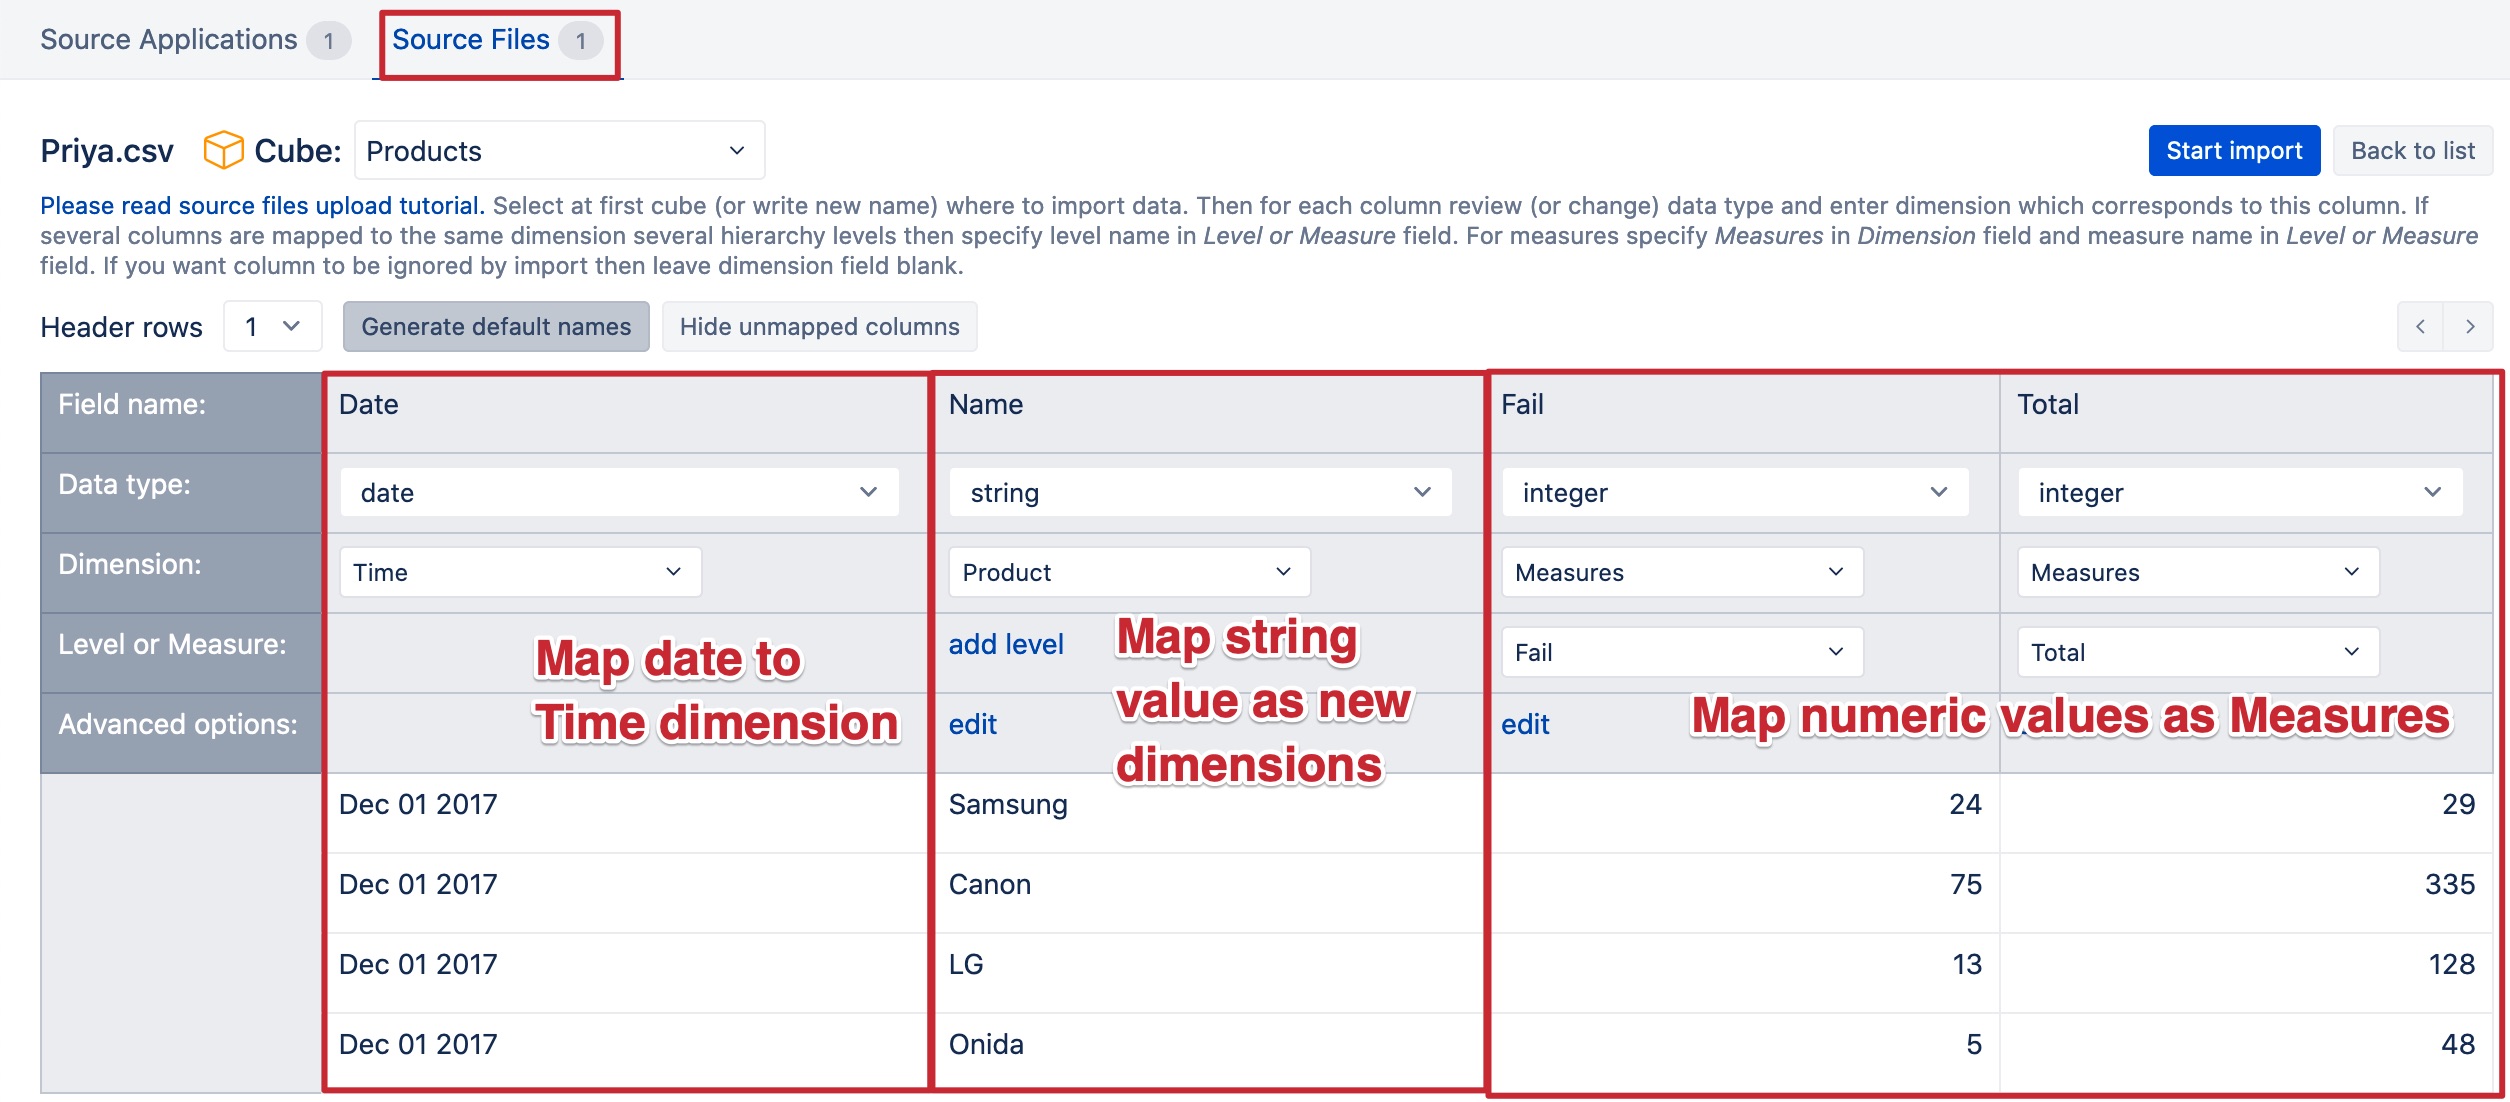
I wanted to know whether i can upload a Custom Excel like the one given below
for eg:
|Date |Name |Fail |Total |
| | | | |
|20171201|Samsung |24 |29 |
|20171201|Canon |75 |335|
|20171201|LG |13 |128 |
|20171201|Onida |5 |48 |
Using this excel will I be able to create charts/Reports/Dashboards using eazybi?
In that case is there any tutorial/Documentation available to see how Custom excel has to be imported, How Measures,PAGES and Dimensions can be added to create Charts?
Kindly help me with this.