Hey I waana see all the active tickets and make a pie chart by Reporter depremant field (text field)
But that field show as property, and I try to use the AI and it also cannot help me.
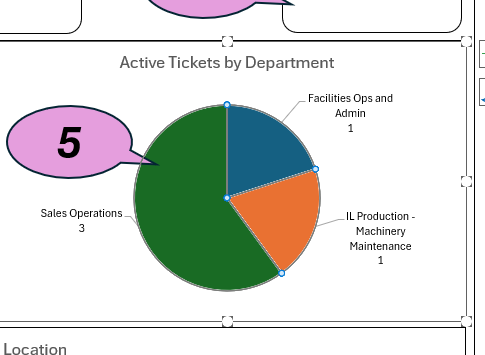
Please see attached picture
Hi, @omri.zeman
Welcom to the eazyBI community.
This was replayed in direct email; here are the resume:
To use the field Reporter department in the pie chart, please import it as a dimension.
Follow these steps:
-
Please go to the Jira import options
-
In the CustomFields tab, find the field “Reporter department” and select Edit.
-
select “Dimension” and Save the settings in the options.
-
Select “Reporter department” to import as a dimension.
-
Perform the import.
Use the imported dimension in the report together with measures like Open Issues to create a pie chart.
Kindly,
Ilze