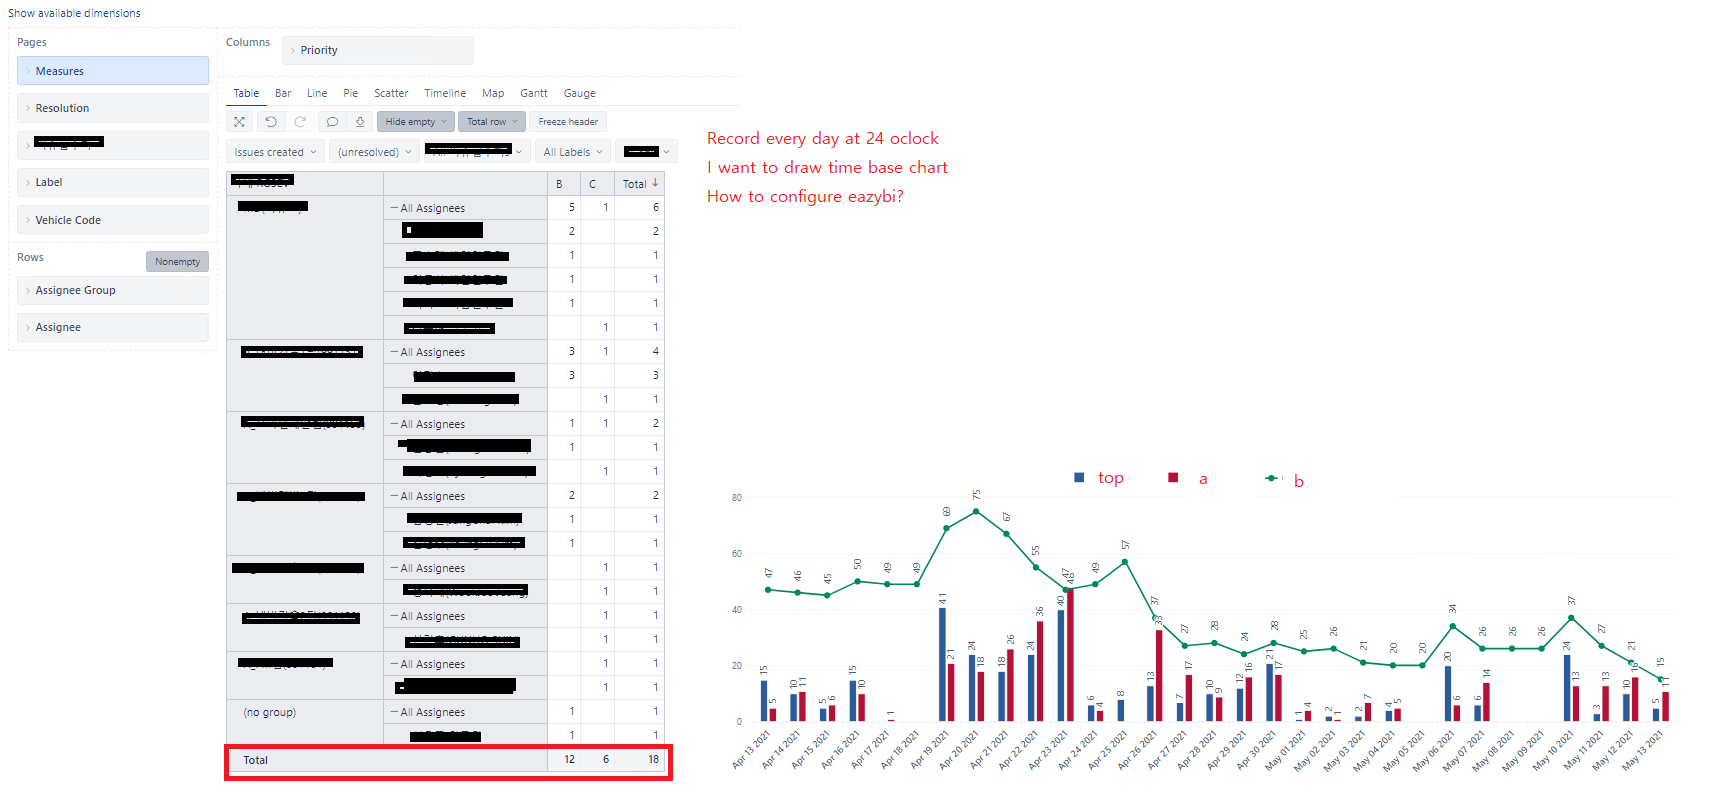
I record issue remain(unresolved) count by priority and special time everyday.
I would like to draw chart form record data
help me
I record issue remain(unresolved) count by priority and special time everyday.
I would like to draw chart form record data
help me
While eazyBI offers historical data analysis, we do not use snapshots for this.
eazyBI imports and calculates historical values based on issue change history entries. We run any calculation in the report, even on historical data, at the moment when you open the report. We can provide results as they were at the end of the day only.
We support change history entries for numeric custom fields and some default fields by default. You would like to enable the change history for some select list custom fields if there is a need.
Please note. We do not support historical data analysis for multi-value fields, like Labels, Fix version, and custom fields.
Daina / support@eazybi.com