Hi, I have two scripted fields. Both are integers used for scoring a Jira issue in two different ways. I am trying to create and chart a time series of the cumulative sum of these two scores for a specific ticket type of a specific project over the past 90 or 180 days. Day level detail is fine. I can get the chart to work but only for scoring changes that are back tagged to the ticket creation date for that scripted field.
What I want is a daily chart (essentially a burn down or up type chart) plotting these two scoring sums on a daily basis and having that chart reflect any changes made to the project and the ticket type for a given day. If the change is back-dated to the ticket creation date it doesn’t make sense as a score change today can be reflected in the chart potentially months ago.
These are my advanced settings:
[jira.customfield_15830]
name = “Score”
data_type = ‘integer’
measure = true
get_changelog_string = true (I tried removing this as well)
And this is what I see on the Jira import options:
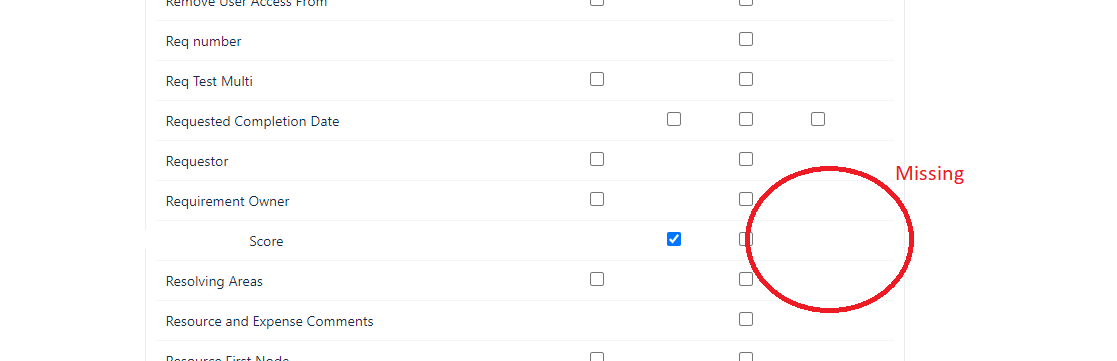
I have ‘Import issue change history’ selected.
Any thoughts?