With the new release of 4.6.2 on October 3rd, 2018, we are not able to remove the “Measures” Dimension from Columns, Rows and Pages when creating new reports. Any ideas on how to fix this?
Hi
In most of the cases, earlier users actually didn’t get the right knowledge how eazyBI is meant to be used - measure is a must have to calculate report. In other words, a measure is a treasure!
Previously, If users didn’t select a measure, the report still was possible (eazyBI then used default measure “Issues created”) and then the next customization was confusing if suddenly some other measure should be used for the report context (for example, the number of issues resolved).
Therefore, we forced this dimension in a report. In the latest versions of eazyBI (since 4.6.0) “Measures” dimension can’t be removed.
Martins / eazyBI support
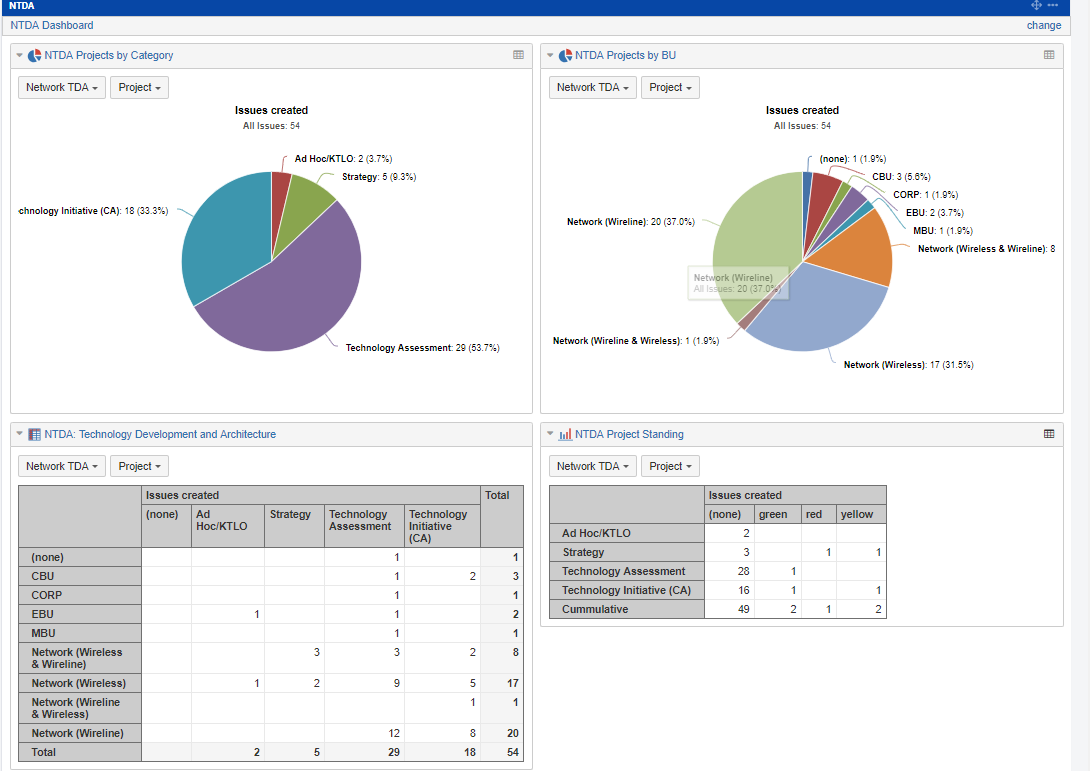
Thanks for the explanation Martins. In that case we would need a way to rename some of the headings. Right now I have a dashboard and executives would be asking if there is a way to remove “issues created” from the tables.
What do you suggest we do here? The only option I see here is to copy “issues created” measure and rename it something else.
Fabian
Try moving “Measures” dimension to pages where only “Issues created” would be selected.
Martins / eazyBI support
Thanks for your prompt response.
I agree that Measures makes it clear what you are doing. But fabian.lim’s issue is a real one. The measure names are not always descriptive to our users. We’ve tried renaming them with custom measures [Measures].[My Name Here] = [Measures].[Issues created]. This works for display, but we think we’re seeing performance issues associated with it.
Could we get something on the roadmap to allow “renaming” of measures, for display, without having to perform a calculation?
Hi,
Thanks for the input.
There is already a feature request to let users change measure display name on our backlog however I can’t share any ETA for this.
We will announce changes in our changelog once this is possible.
Martins / eazyBI support
Hi Martins,
We’re still struggling with this one; we keep on creating calculated measures and members in order to customize the display (column heading, member names in rows, title of a bar chart that shows above the legend, etc) and running into performance issues and errors that are visible to users (like timeouts, “illegal capacity”, child process restarting, etc).
Especially in charts, wouldn’t it be more efficient to just customize in-place the labels/titles that are displayed, like we do with the colors? I know we can customize the axis titles, but those show up below the axis and not at the top where people are looking for the report’s/chart’s title.
We would really appreciate you prioritizing such functionality, and as always, thanks for all your help.
Elena.
1 Like