Hello, I’m new to using EazyBi and I would like to know if there is a way to make a graph that shows the number of days a card is in Sprint. We use Jira as a data source.
Thanks!
Hello, I’m new to using EazyBi and I would like to know if there is a way to make a graph that shows the number of days a card is in Sprint. We use Jira as a data source.
Thanks!
Hi Lucas,
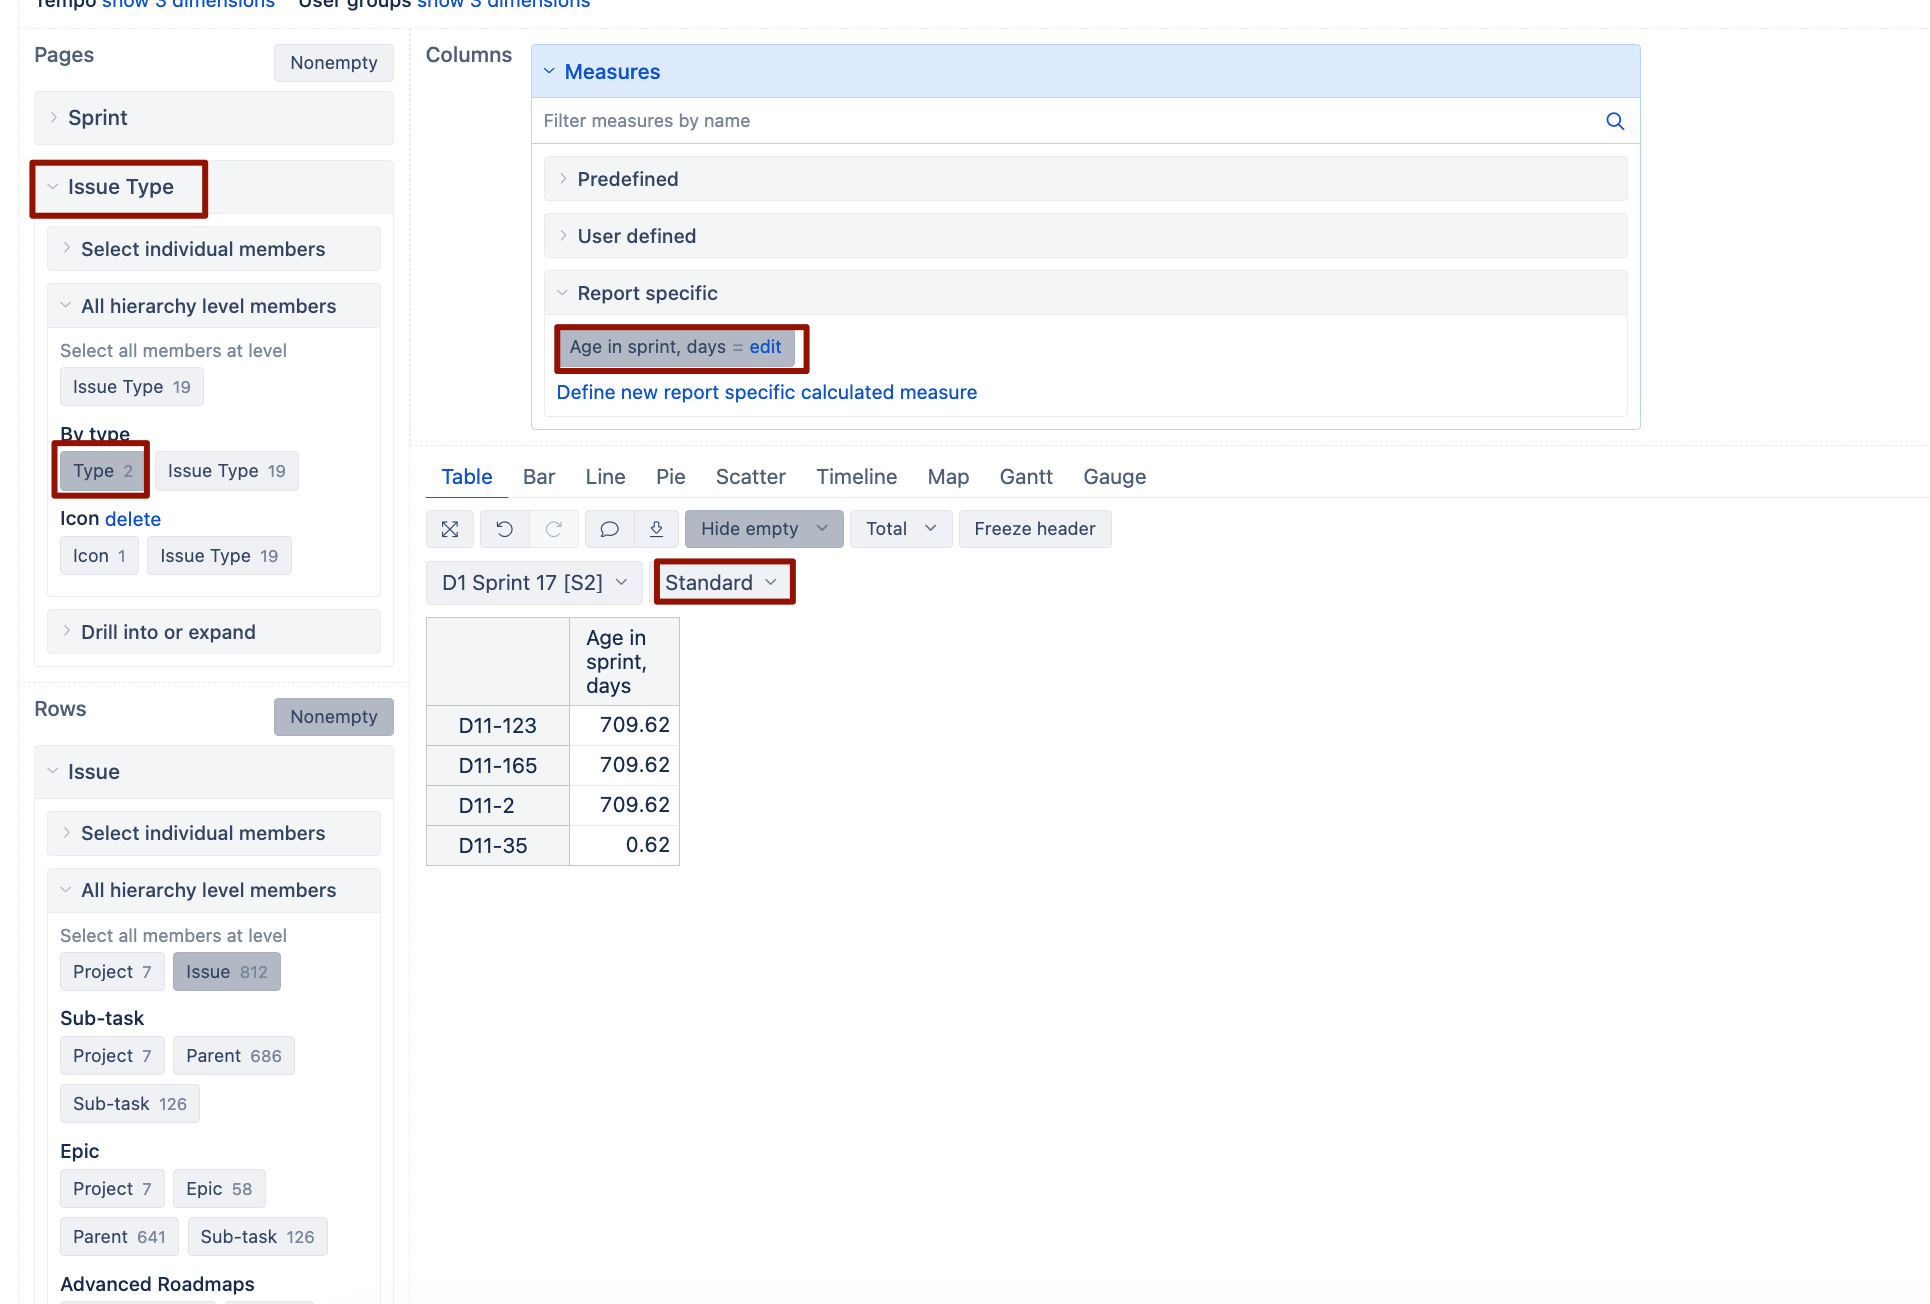
Try creating a new calculated measure with decimal formatting using this MDX formula:
DateDiffDays(
  Filter(
    DescendantsSet([Time].CurrentMember,[Time].[Day]),
    ([Measures].[Sprint issues committed]
    +
    [Measures].[Sprint issues added]
    -
    [Measures].[Sprint issues removed])
    >0
  ).item(0).StartDate,
  now()
)
I would recommend filtering the report by “Issue Type” dimension and select “Standart” category from “Issue type.BY Type” hierarchy to avoid having misunderstandings from sub-task.
eazyBI won’t see the sprint history for sub-tasks:
https://docs.eazybi.com/eazybi/data-import/data-from-jira/jira-software-custom-fields#JiraSoftwarecustomfields-Sprintscopemeasures
Martins / eazyBI team