Hi all,
Just started using, so apologies if this turns out to be simple - I’m getting there but there are bits that still haven’t “clicked” (though I will say that even just playing with it on our staging platform we are able to produce stuff that is far better than without it, very excited to see what we can produce once we are more into it)
We use Jira SD for Change Management and trying to build a resolution graph.
There are two things that I haven’t quite got the hang of though:
-
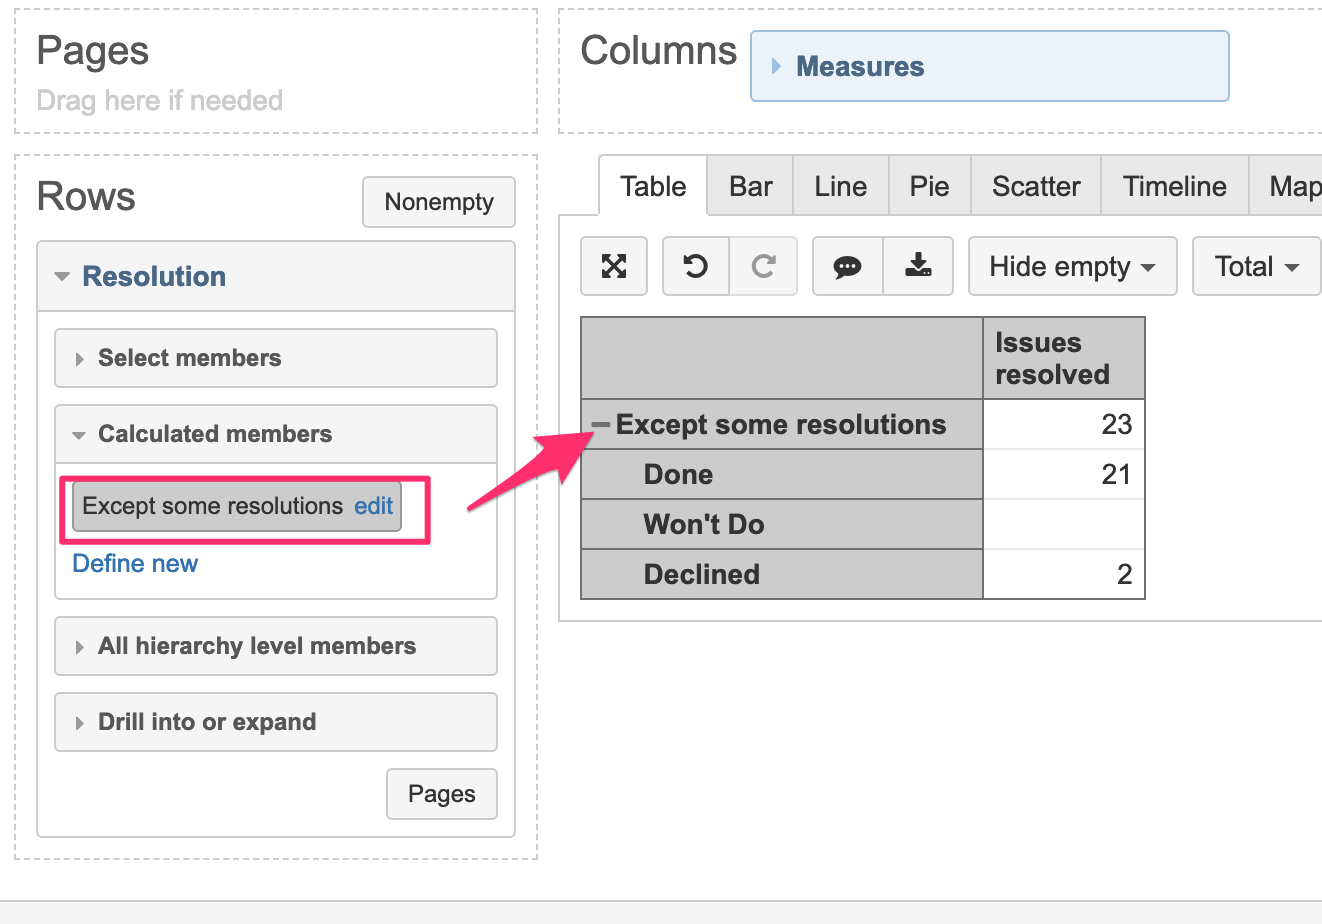
There are 6 resolution types plus unresolved - how do i define so that only specific resolution types are in the result (eg ignore “unresolved” and “Rejected”) - I thought I knew how to do this using calculated members but I’m guessing either I’m wrong in what I’m doing or I’m doing it wrong
-
The report is supposed to show weekly resolutions, but it appears to be graphing by the date that the resolution field was changed, which is usually but not always the same day as “Requested Window End” custom date field - and I need it to graph by “Requested Window End”.
In other words, the graph should be showing the resolution of an issue, based on the [window of that change] field mentioned above rather than the date the resolution changed. Any ideas how I do that?
Thanks in advance
edit: Ok I think I’ve worked it out - the bit I think I am misunderstanding is the measures custom fields.
If measures is in Columns, and I deselect “issues created” and select “Issues with Requested Window End” (custom field) is that purely a filter (must be a value in that custom field) or does it then use the dates in that field as the time? The way the name of the button is phrased makes it sound like a filter only, but…