Hi there!
I would like to know if there is way to add totals in the legends as well as move the legends to the bottom of a bars chart like this one:
Thanks
Javier
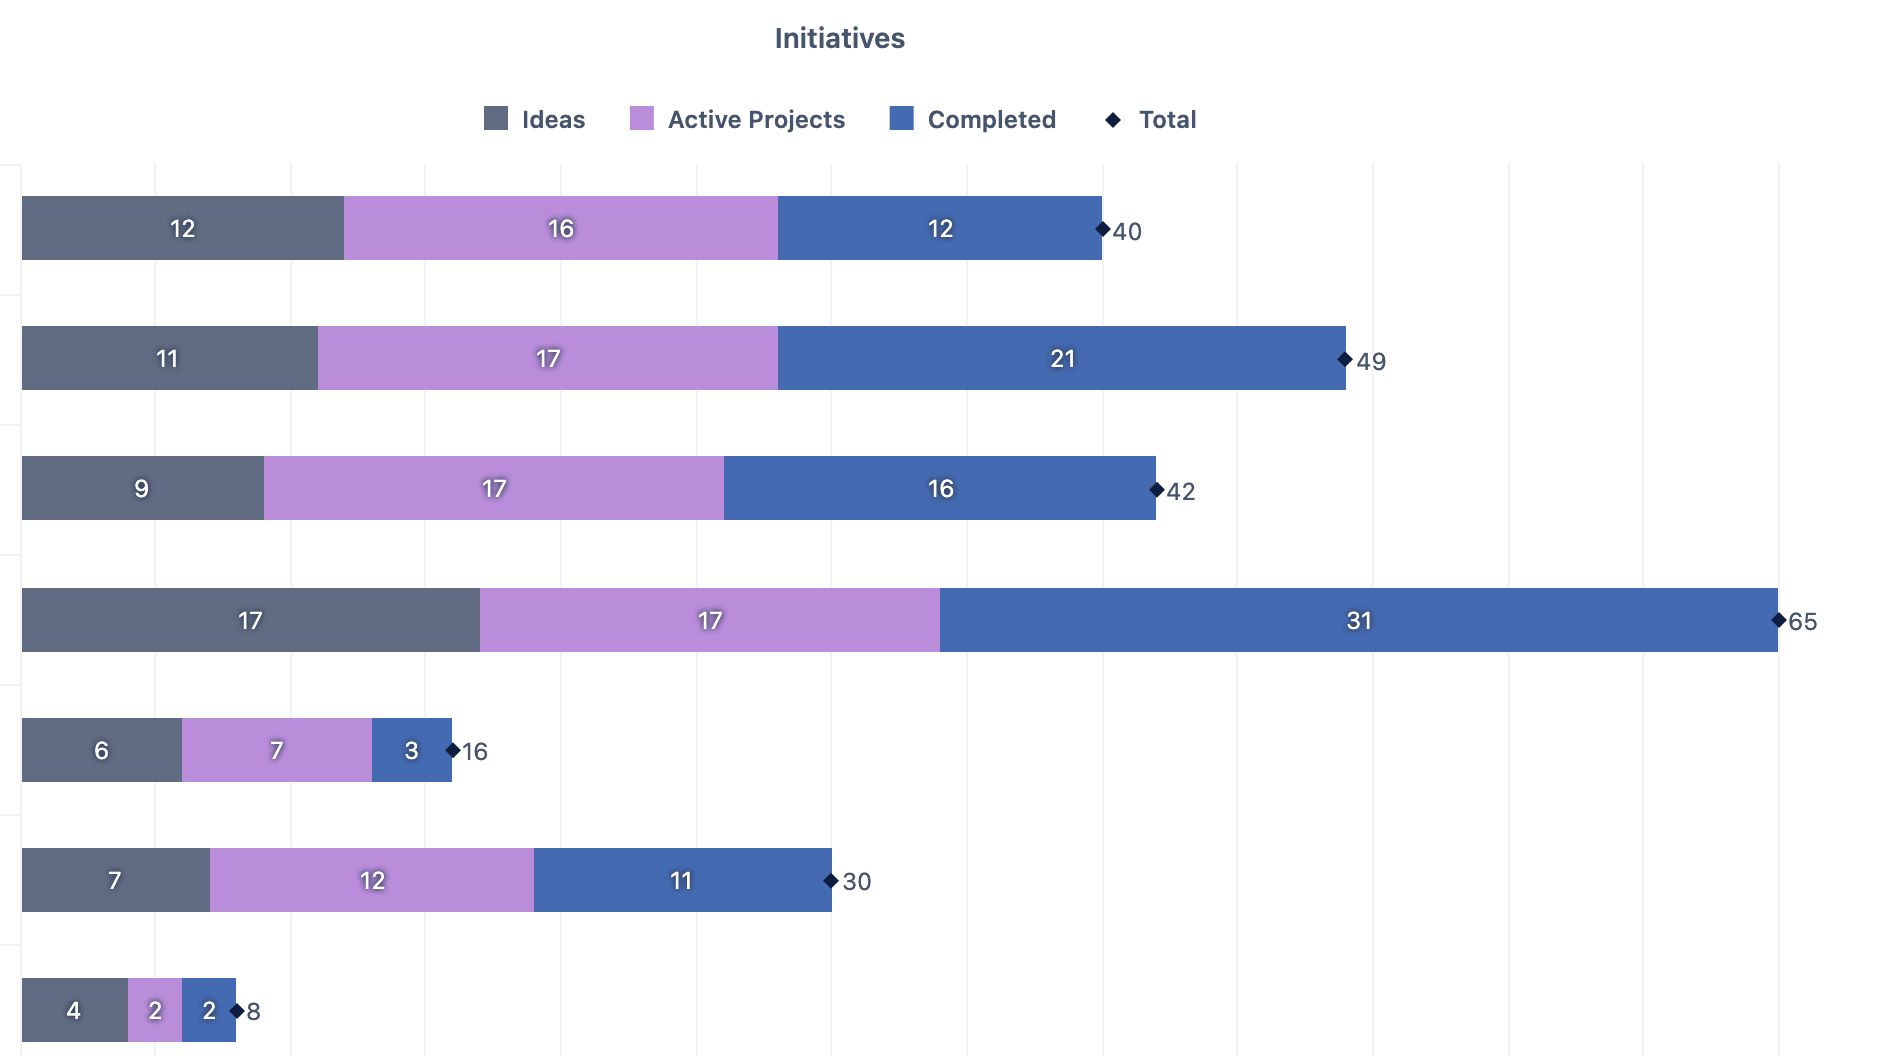
Maybe I wasn´t so clear in my post, but what I’m looking for is to get the totals in each one of the legend categories like this:
![]()
This example was taken from Jira Custom Charts.
I know I can add a table with totals, but it’s not the idea.
Thanks
Javier
We discussed this topic internally, but I will share a response here too in case other eazyBI users may be searching for something similar.
Currently, eazyBI bar charts don’t support adding total values directly to the chart legend or repositioning the legend to the bottom of the chart.
You can achieve a similar visual result by creating a dashboard with two complementary reports:
Main Bar Chart - Create your stacked bar chart showing the breakdown by categories
Gauge Chart for Totals - Create a separate report with the same data
Select the gauge chart type
Use the “Only values” option to display totals
The color-coding will help connect the gauge values to their corresponding bars
When you place these two reports side-by-side in a dashboard, you’ll get a visual representation with totals displayed next to the corresponding bars.
We also discussed this use case internally, and displaying totals separately within the same chart has been registered as a feature request.
Best wishes,
Elita from support@eazybi.com