I need to create a chart and set a budget of 60 hours per month, and calculated remain hours and for the next month the accumulated of remain+month budget. Im stuck in accumulated function, because i dont knot how to pick up the remain hours of previus month and add on current month and change the accumulated when i change the time filter . I really need to build this chart
Hi @Viol1914
Thanks for sharing your use case!
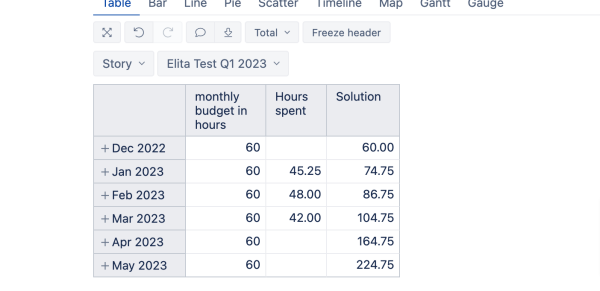
I have given an example of a possible solution to your use case. I’ve used the “Hours spent” measure in my example, to calculate the spent hours, but in your scenario, this might be a different/custom measure.
You could start by defining a measure “monthly budget in hours”, formula might look like this:
CASE
WHEN
[Time].CurrentHierarchyMember.Level.Name = "Month"
THEN
60
END
And then you could create the following calculated measure to use the monthly budget amount (60 hours) and the hours from previous month which were not spent.
CumulativeSum([Measures].[monthly budget in hours]) -
CumulativeSum([Measures].[Hours spent])
Best wishes,
Elita from support@eazybi.com