For this report, you might want to use the measure “Issues created count” or “Issues resolved count” (if yuo want to analyze only resolved bugs). Those measures count issues only to the last sprint they are assigned (in eazyBI, we use the current sprint).
More details measures and how they work with Sprint dimension: Jira Software custom fields
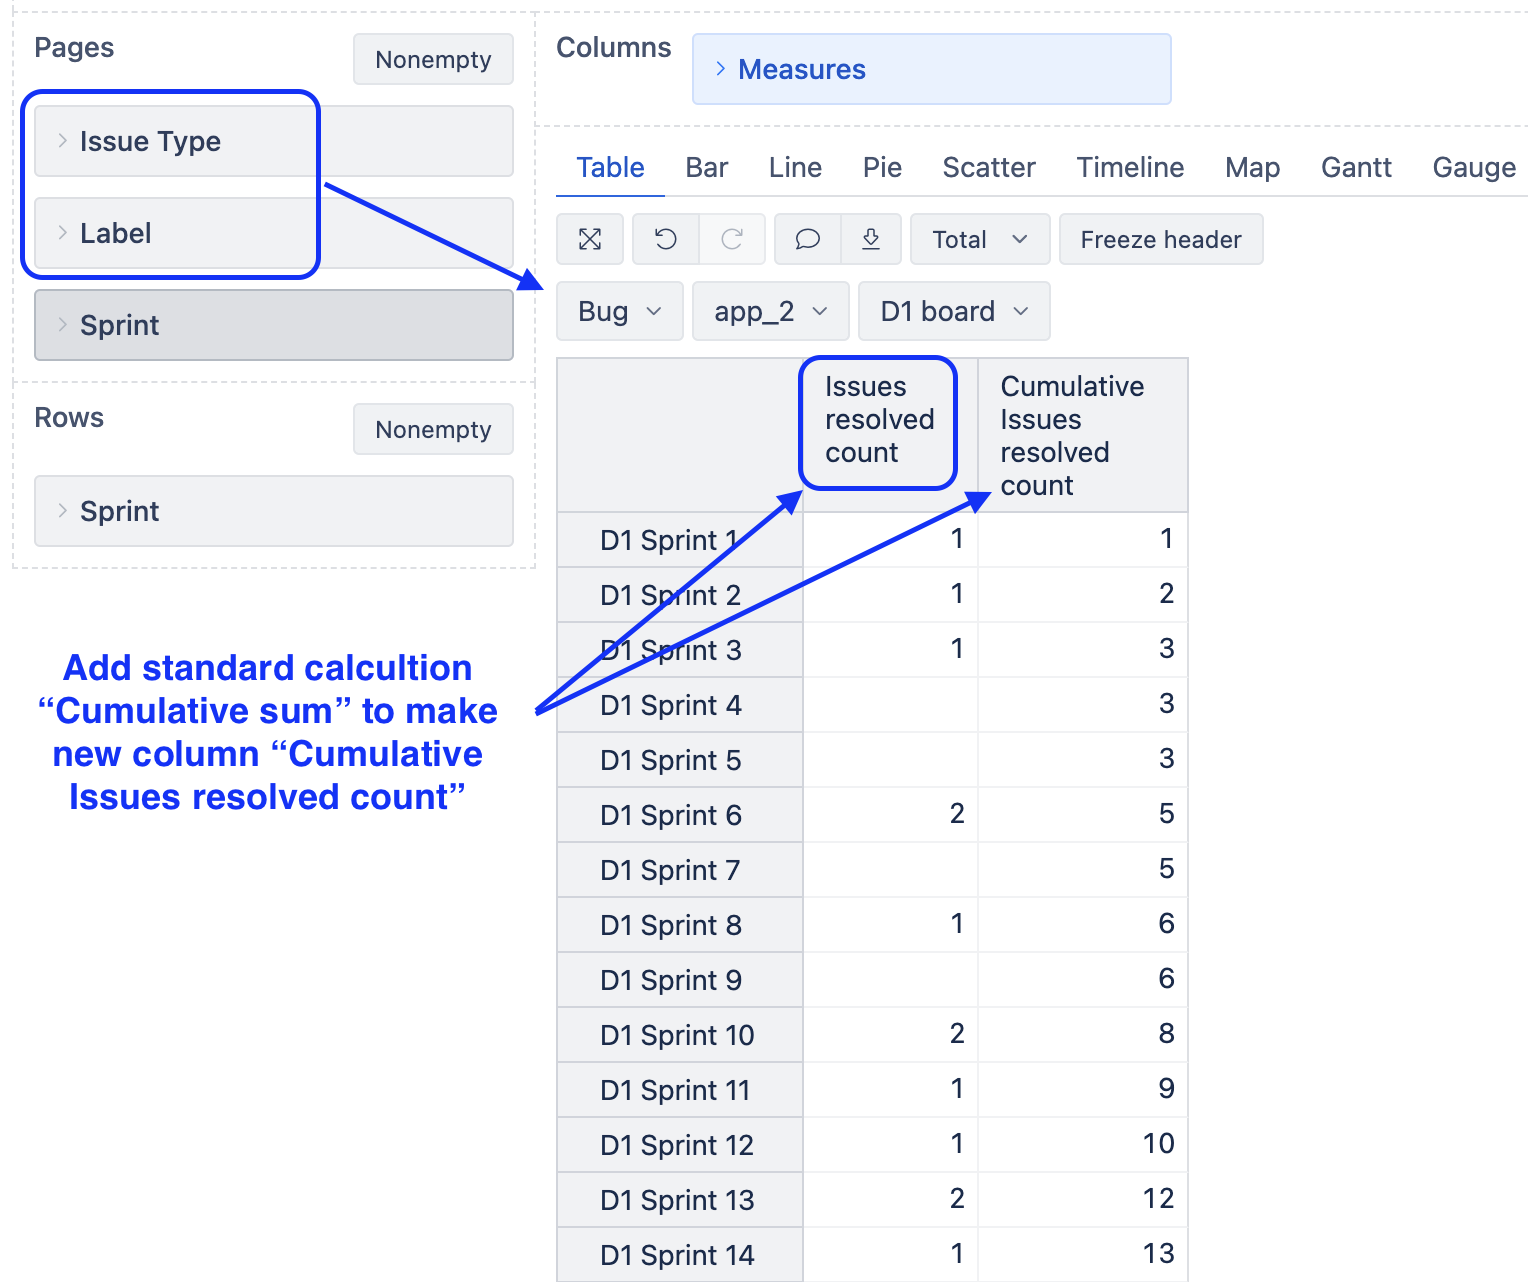
To get the cumulative amount, click on the column heading for “Issues resolved count” and add the standard calculation → cumulative sum. For more details, see the documentation: Create reports)
Set the “Issue Type” dimension on pages and filter only “Bugs”.