I have a issue-list change history report for single-select custom field which is working nicely.
It shows list of issues (epics with some page filtering) as rows and columns contains months and the values are the custom field string values (2023-Q1, 2023-Q2, 2023-Q3, etc…) selected for each epic.
but I want to have either conditional formatting to highlight rows which has been changed (based on the value in previous column which is time) AND/OR report which lists only the rows which has been changed.
Assuming you have imported issue change history for your custom field “Increment” (learn more here - Import issue change history) , you could do the following steps:
Add the propery “Issue Increment” in your report, this will display the current Issue increment value. To count the nr of changes, you can define a new calculated measure with the Tuple (Tuple) function with formula below:
This will return the number of changes. Note that if it shows 1, it means that the issue was initially created with no Increment value, but if later on the increment was added - the returned value would show as “1” when, in fact - there was no change, or the change is considered as for example “none” → “2023-Q1”.
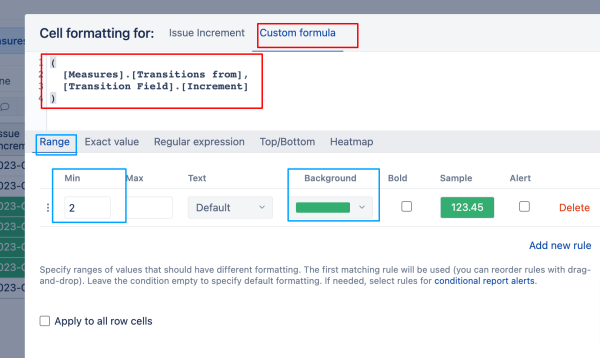
To highlight the values, that changed, you can click on the measure/property name “Issue Increment” → Cell formatting (Conditional cell formatting)
Then select “Custom formula” and paste the formula I wrote above.
Proceed with selecting “Range” tab as marked in screenshot below. Apply min value “2” and select the color you would like the rows to be highlighted in case there was a change from one increment value to another one.
This should be the result :
Let me know if this works for you!
Now, the report would be perfect if it would show just the issues where the Increment value has been changed (preferably from quarter to another, not from none to new value).
Idea behind this report is to list Epics what was kind of leftovers from previous quarter and product owner has decided to keep it on-going in the next quarter by changing the Increment value to next or some other future quarter
Thanks already for this
Edit… Of course I can now just remove the issue increment property from the measures, remove empty rows and filter >= 2 for the count of increment changes and ta-da! Sure it would be beautiful to have current increment value and date of change, but I think I’m already happy with this
My very sincere apologies for such delayed response.
I am glad the first solution worked for you!
For your additional question, if it is still relevant (even if not relevant, I’d still recommend to test it for practising purposes), you could do the following steps.
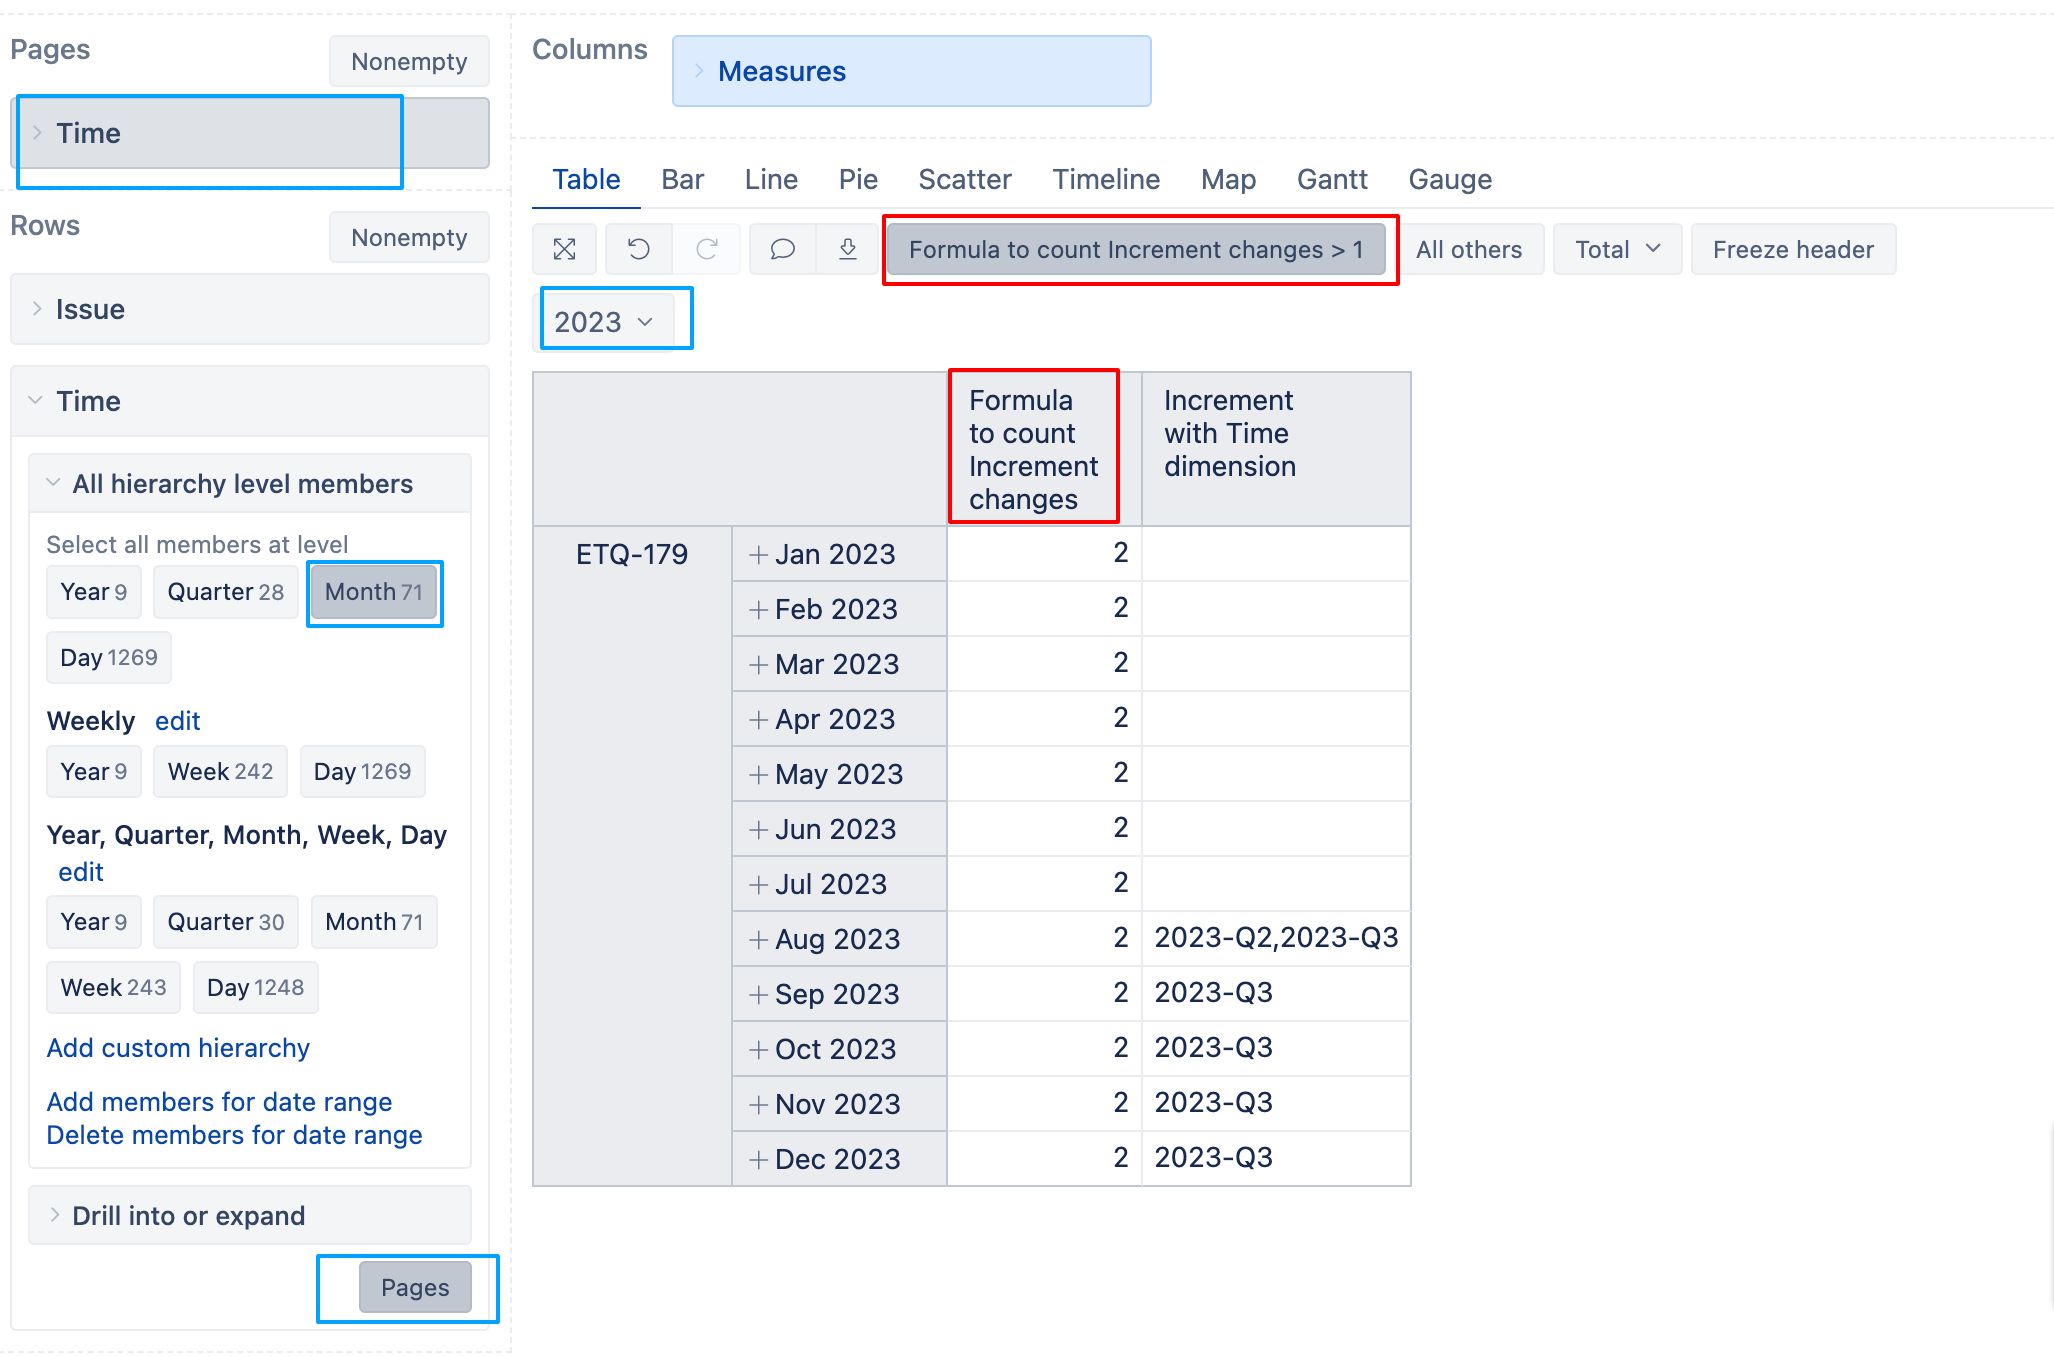
First start by adding a formula below. In my screenshot below I have named it "Increment with Time dimension"
Generate(
  Filter(
    [Increment].[Increment].Members,
    [Increment].CurrentMember.Name <> "(none)" AND

  not IsEmpty([Measures].[Issues history])
  ),
  [Increment].CurrentHierarchyMember.Name,
  ","
)
Then filter your measure “Count of issue increment changes” to be larger than 1, similarly as I have done in the screenshot below. Then you could add the Time dimension in Rows and Pages. You can filter the report by this year (or any other member you seem fit for your report) and select Month level. The report will return the Issue Increment value for the Time dimension according to what value was active on that particular month. In my example below you can see two values against August 2023. If you expand the member at day level, you will notice on which day, the change happened