I have a bar chart that I would like to color based on the %complete vs the % of days that have passed in a time period.
Trying the following formula:
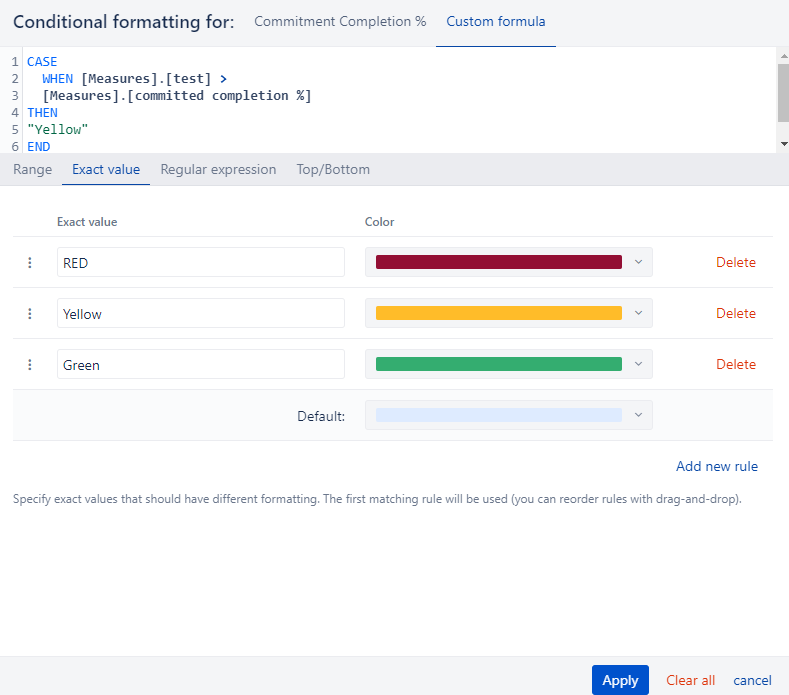
CASE
WHEN (DateDiffDays(DateParse(‘2023-03-08’), Now())/ 84) >
[Measures].[committed completion %]
THEN
“Yellow”
END
I have an exact formula called “yellow” that has the color yellow defined.
The table does not change but I can see that the calculated number is 23, and the committed complete ranges from 4-21%
Please help, this is driving me crazy!
Hi @Jade_Stephen
Welcome to the eazyBI community!
Sometimes it is frustrating to find the problem. The best way to debug is to create a new calculated member with part from the formula and then check the result.
For example, I choose the part of your formula, DateDiffDays(DateParse("2023-03-08"), Now())/84
and it gives me 0.32.
I don’t know what values you have in the measure - committed completion %, but it seems those values aren’t the same. 0.32 < 4-21%
Please let me know how it went.
Kind regards,
Ilze