Hi,
I have created 2 reports to show the planned progress vs actual progress in a PI as shown below
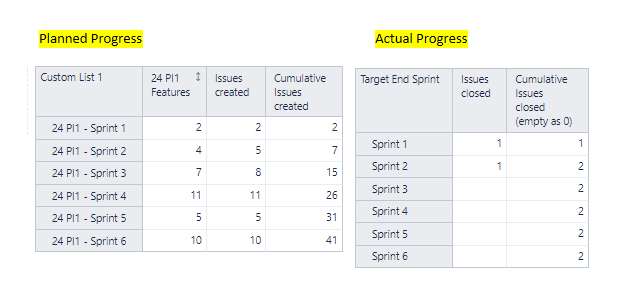
Rather than having 2 reports, I wanted to have one report which will show Cumulative of issues created and issues closed so that I can use a line chart to compare planned progress vs actual progress.
or is it possible to combine these 2 tables in one report so that I can create line chart for Cummulative Created and Cumulative closed.
Also,
Planned progress has rows from Custom List1
Actual progress has rows from Jira field called Target end sprint
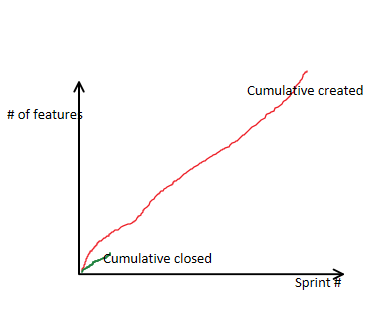
My goal is to create a graph like this to show the progress
Any help will be great for me to proceed.
Thanks