Issues created over time, Issues Resolved over time, Average resolution days over time.
These can be 3 separate reports.
Sample Issues Created over time
nice to have : ( Can the yearly column be configurable) so I can select , 2022 - 2023, or 2022, 2024, or 2022,2023,2024 etc?
Month. |. 2022 | 2023 | 2024 | 2025
January 10. 15. 18. 20
February 20. 13. 18. 20
…
June. 23 20 19 (null) or empty as its not June 2025 yet.
can you please provide some help on how i can build this report?
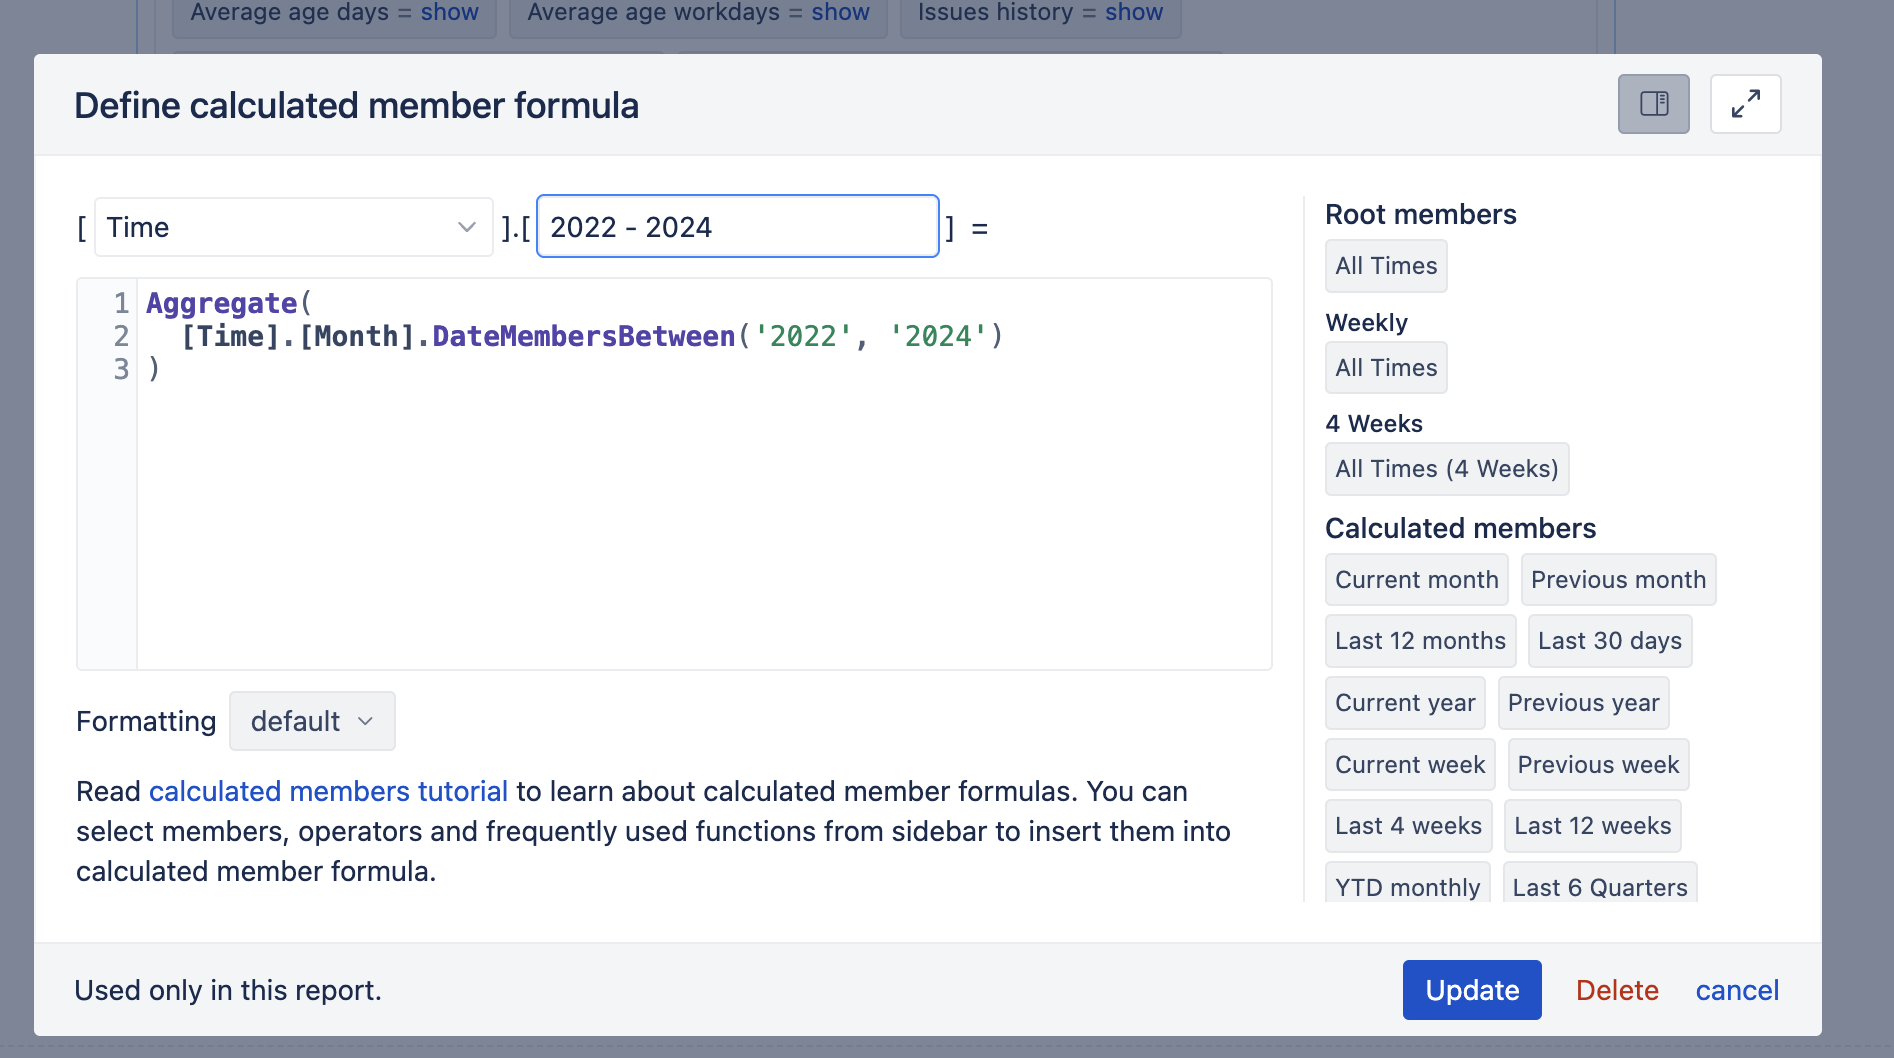
You have to create a new Calculated Time member. Open the Time dimension and at the bottom you have the “Define new calculated member”
it will pop-up a window and there for instance for all of the months, because you want to have it by Month, you can do this:
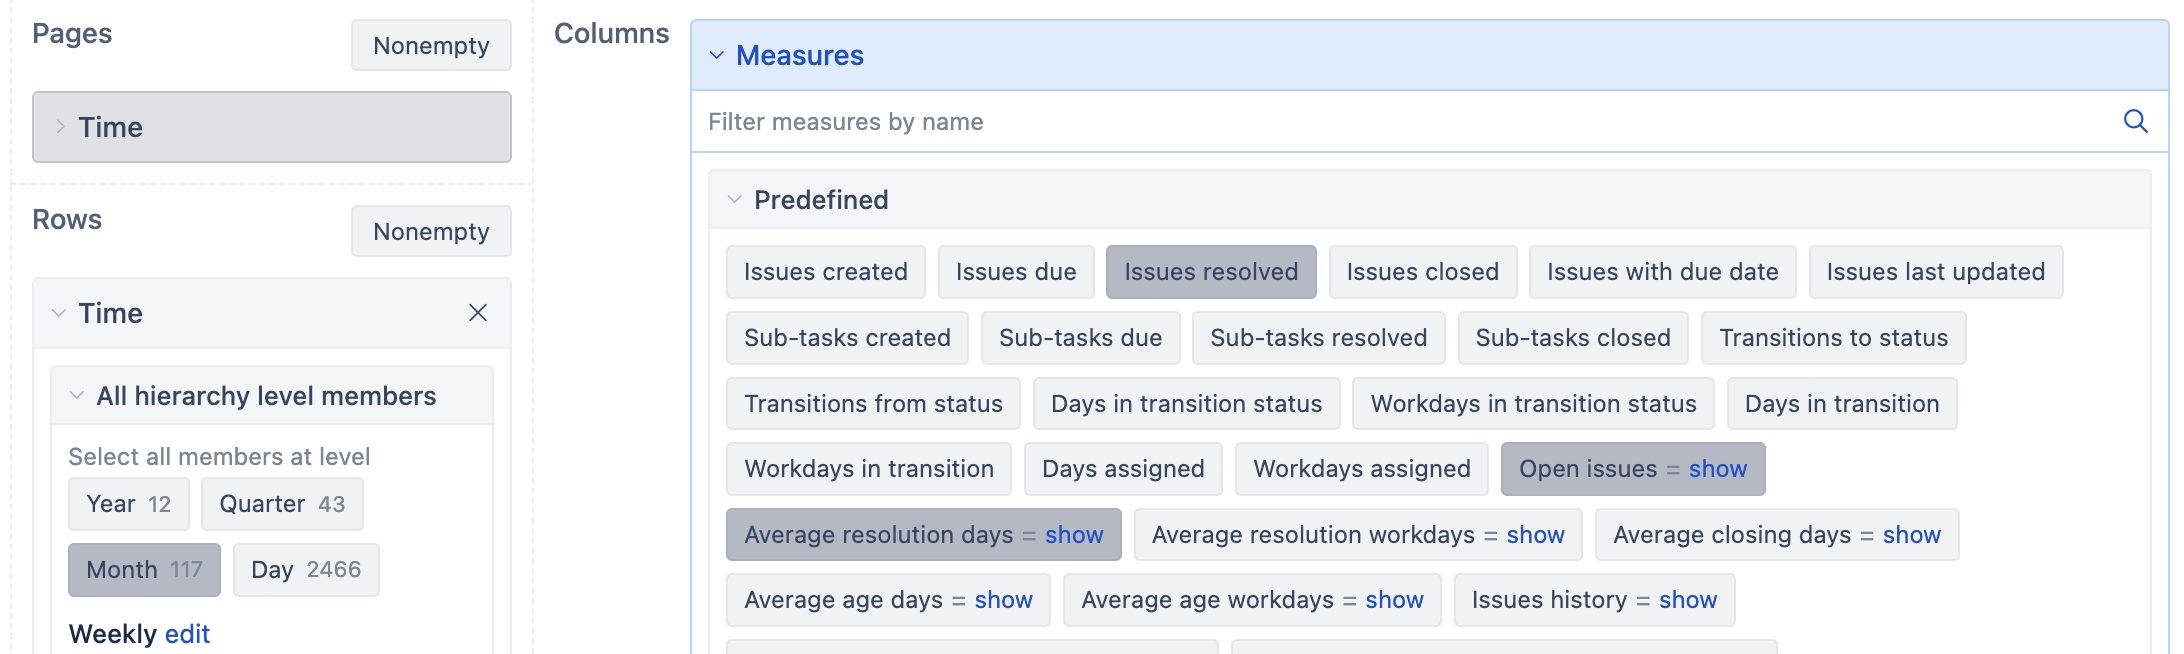
Then, in the Columns the Measures with these 3 you want selected.
In the Rows the time, with the “Pages” button selected too to make available as a filter. and selected the “Month” as you can see below.
And in the Time Dimension, you can create as many aggregations you need and select them to make available in the page filter:
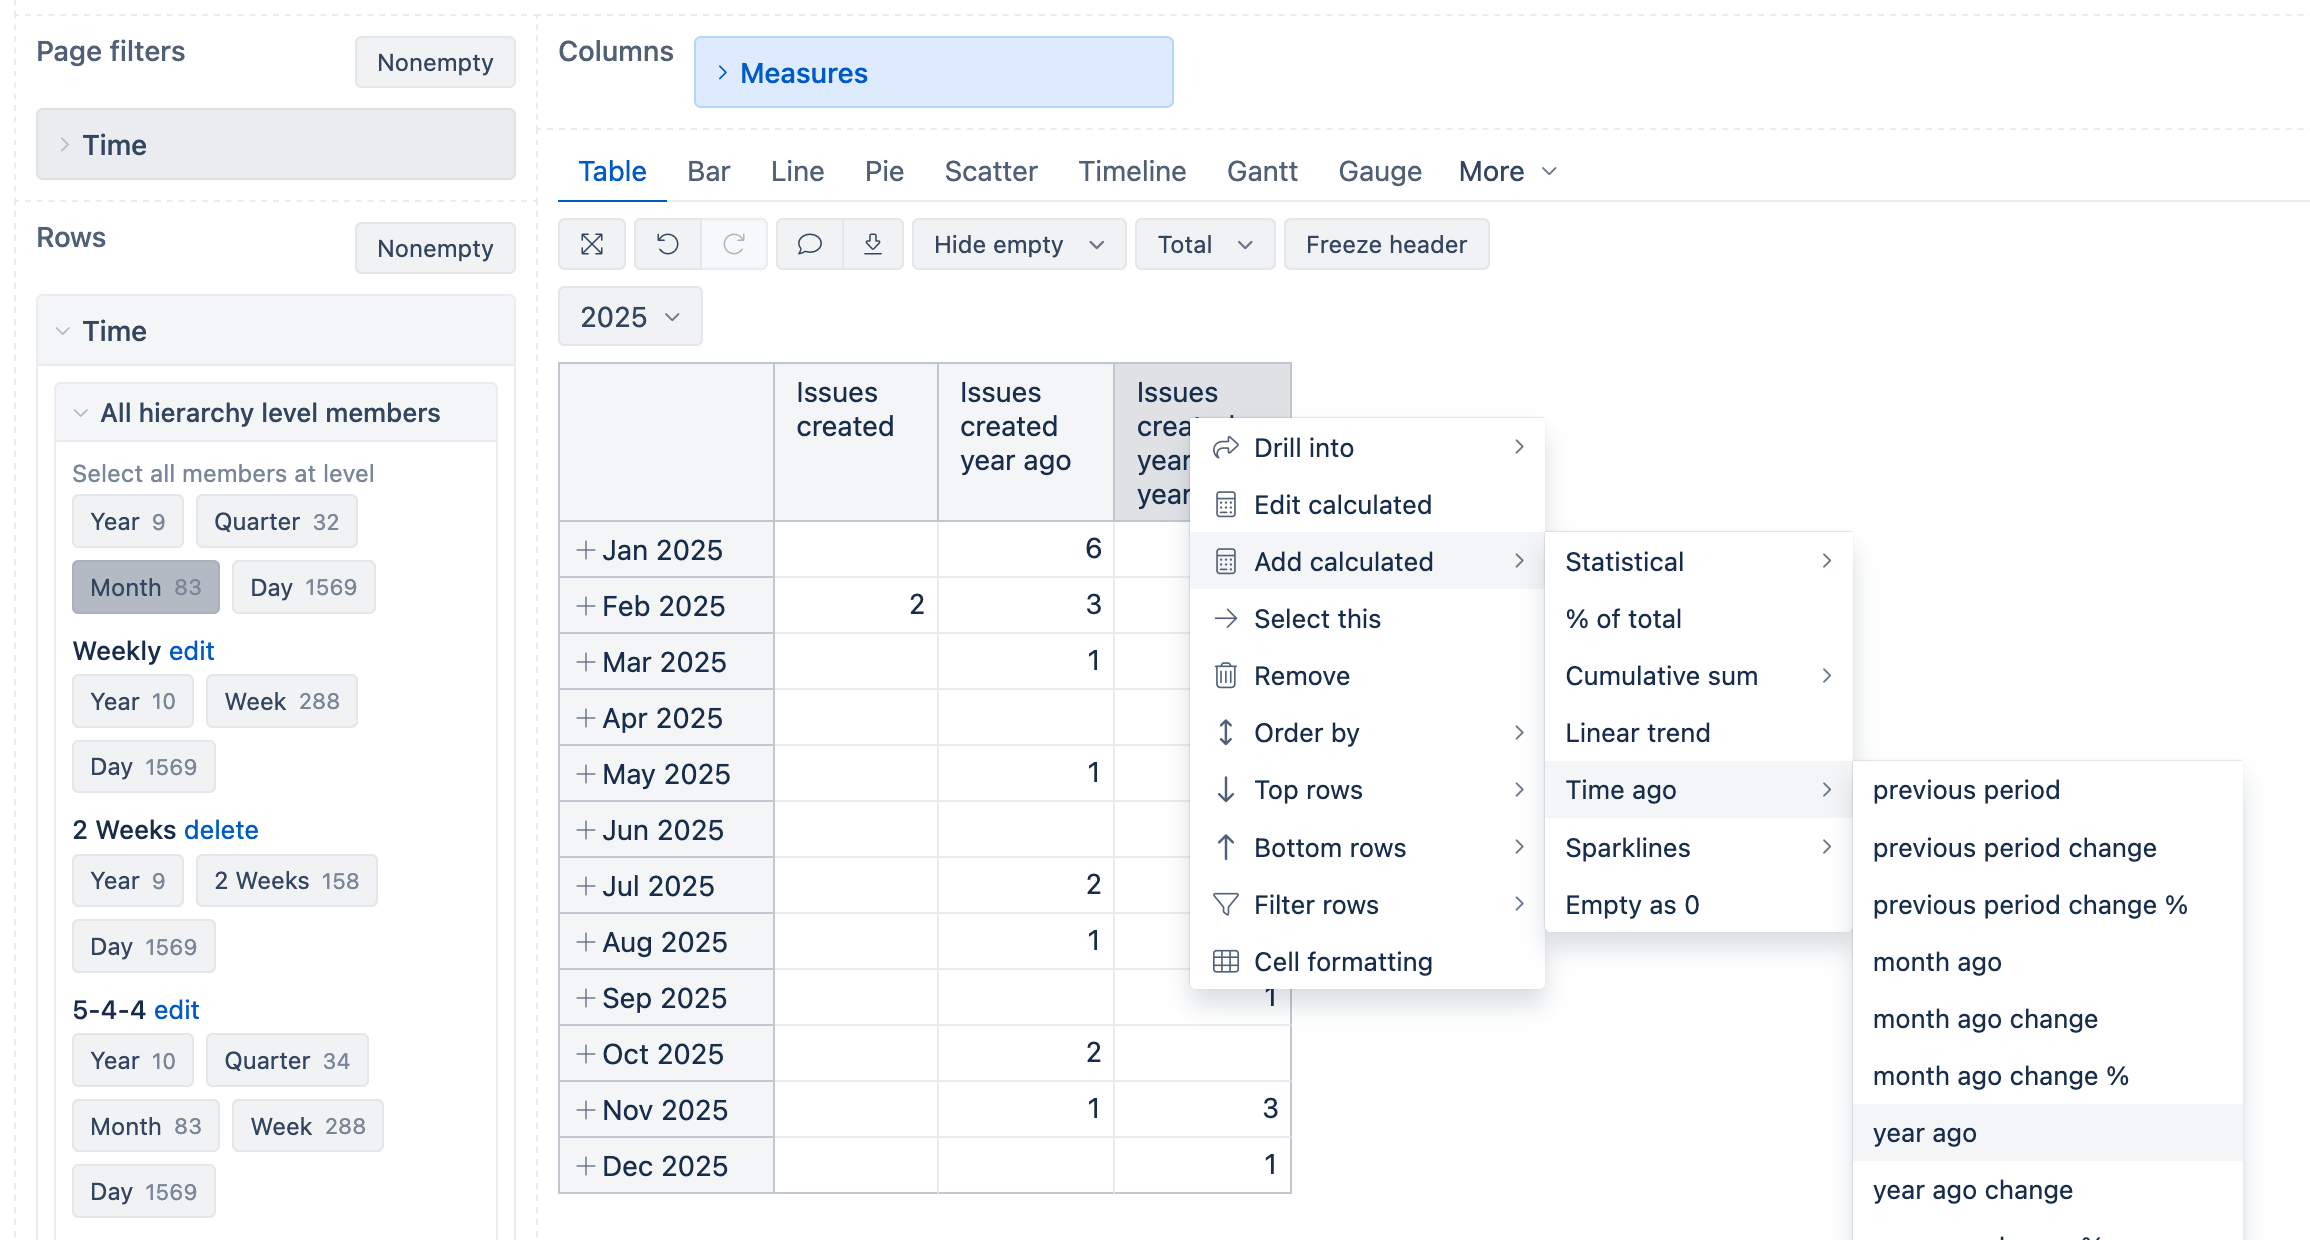
The recommended solution to this use case is to use the standard calculation "Year ago’
You can create a report with months in report rows and filter it by year 2025 (note also to generate all Time mebers for current year: Time dimension).
Add the Issues created (or Issues resolved) and then click on column header.