I need to caluclate the percentile of issues issue types completed in a specific time.
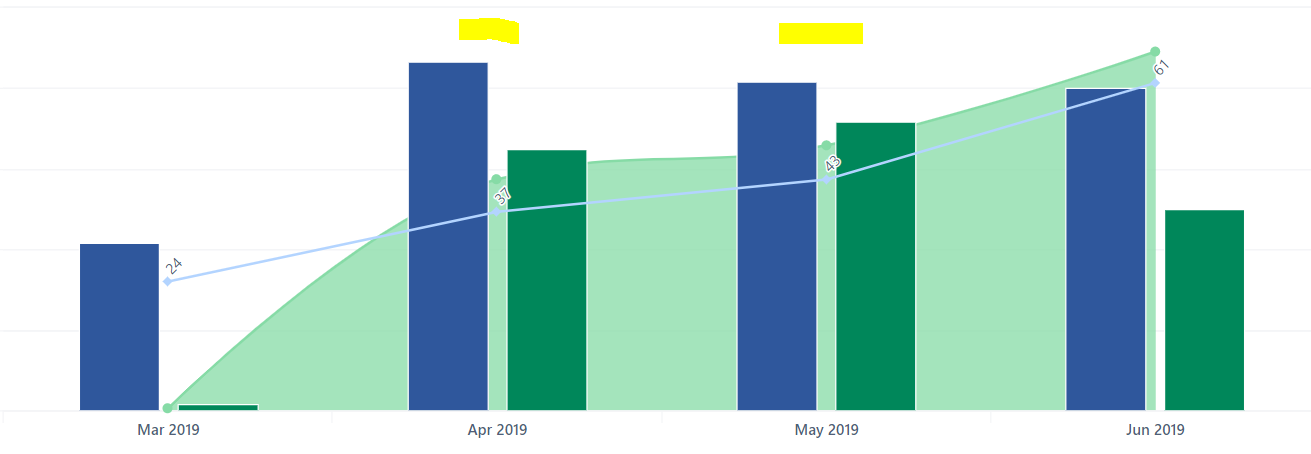
- When 1000 (stories) are created and 400 are completed. ( I need the percentage to be displayed on the chart. any options to check.
I need to caluclate the percentile of issues issue types completed in a specific time.
@shiva
You could create a new user-defined calculated measure with % format where you divide issues resolved by issues created and then show the value on the separate vertical axis in the chart.
See training episodes to find out more:
https://docs.eazybi.com/eazybijira/learn-more/training-videos
Martins / eazyBI support
@martins.vanags
Thanks for the solution.
And i have created the chart for issues resolved in current year.
What i need is ( Issues that are resolved in the currnet year which are also created in the current year not before)
this is possible.
In that case, you can’t use predefined measures anymore.
Try this formula when creating a new user-defined calculated measure (with integer formatting)
SUM(
  Filter(
    Descendants([Issue].CurrentHierarchyMember,[Issue].[Issue]),
    DateInperiod(
      [Measures].[Issue created date],
      [Time].CurrenthierarchyMember
    )
    AND
    DateInperiod(
      [Measures].[Issue resolution date],
      [Time].CurrenthierarchyMember
    )
    AND
    [Measures].[Issues resolved]>0
  ),
  CASE WHEN
  [Measures].[Issues created]>0
  THEN
  1
  END
)
When selecting this measure, make sure you enable “Nonempty” cross join for report rows for faster computing.
Best,
@martins.vanags
thanks