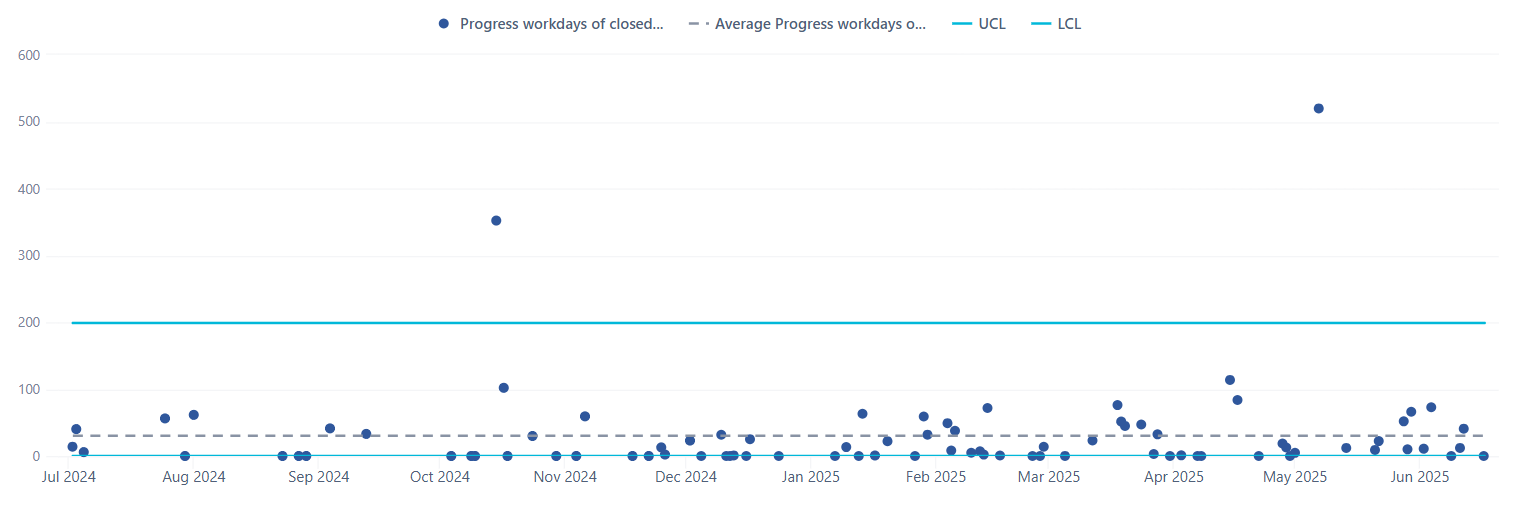
I was able to create this fantastic Control Chart…
But I’m missing some requirements… And I don’t know how to fix it.
I have some dots that are actually the sum of 2 issues… You can easily see two of them as they are both above the UCL. But in the best of world, I would have liked to see a dot per issue (not a sum of both). Now, from what I understand, in a Timeline it is not possible to undo the “sum”… Unless someone tells me otherwise. Any help to create such a chart will be greatly appreciated.
I created the same graph in a Bar chart as well, but I still can’t distinguish the issues completed on the same day…
HELP…
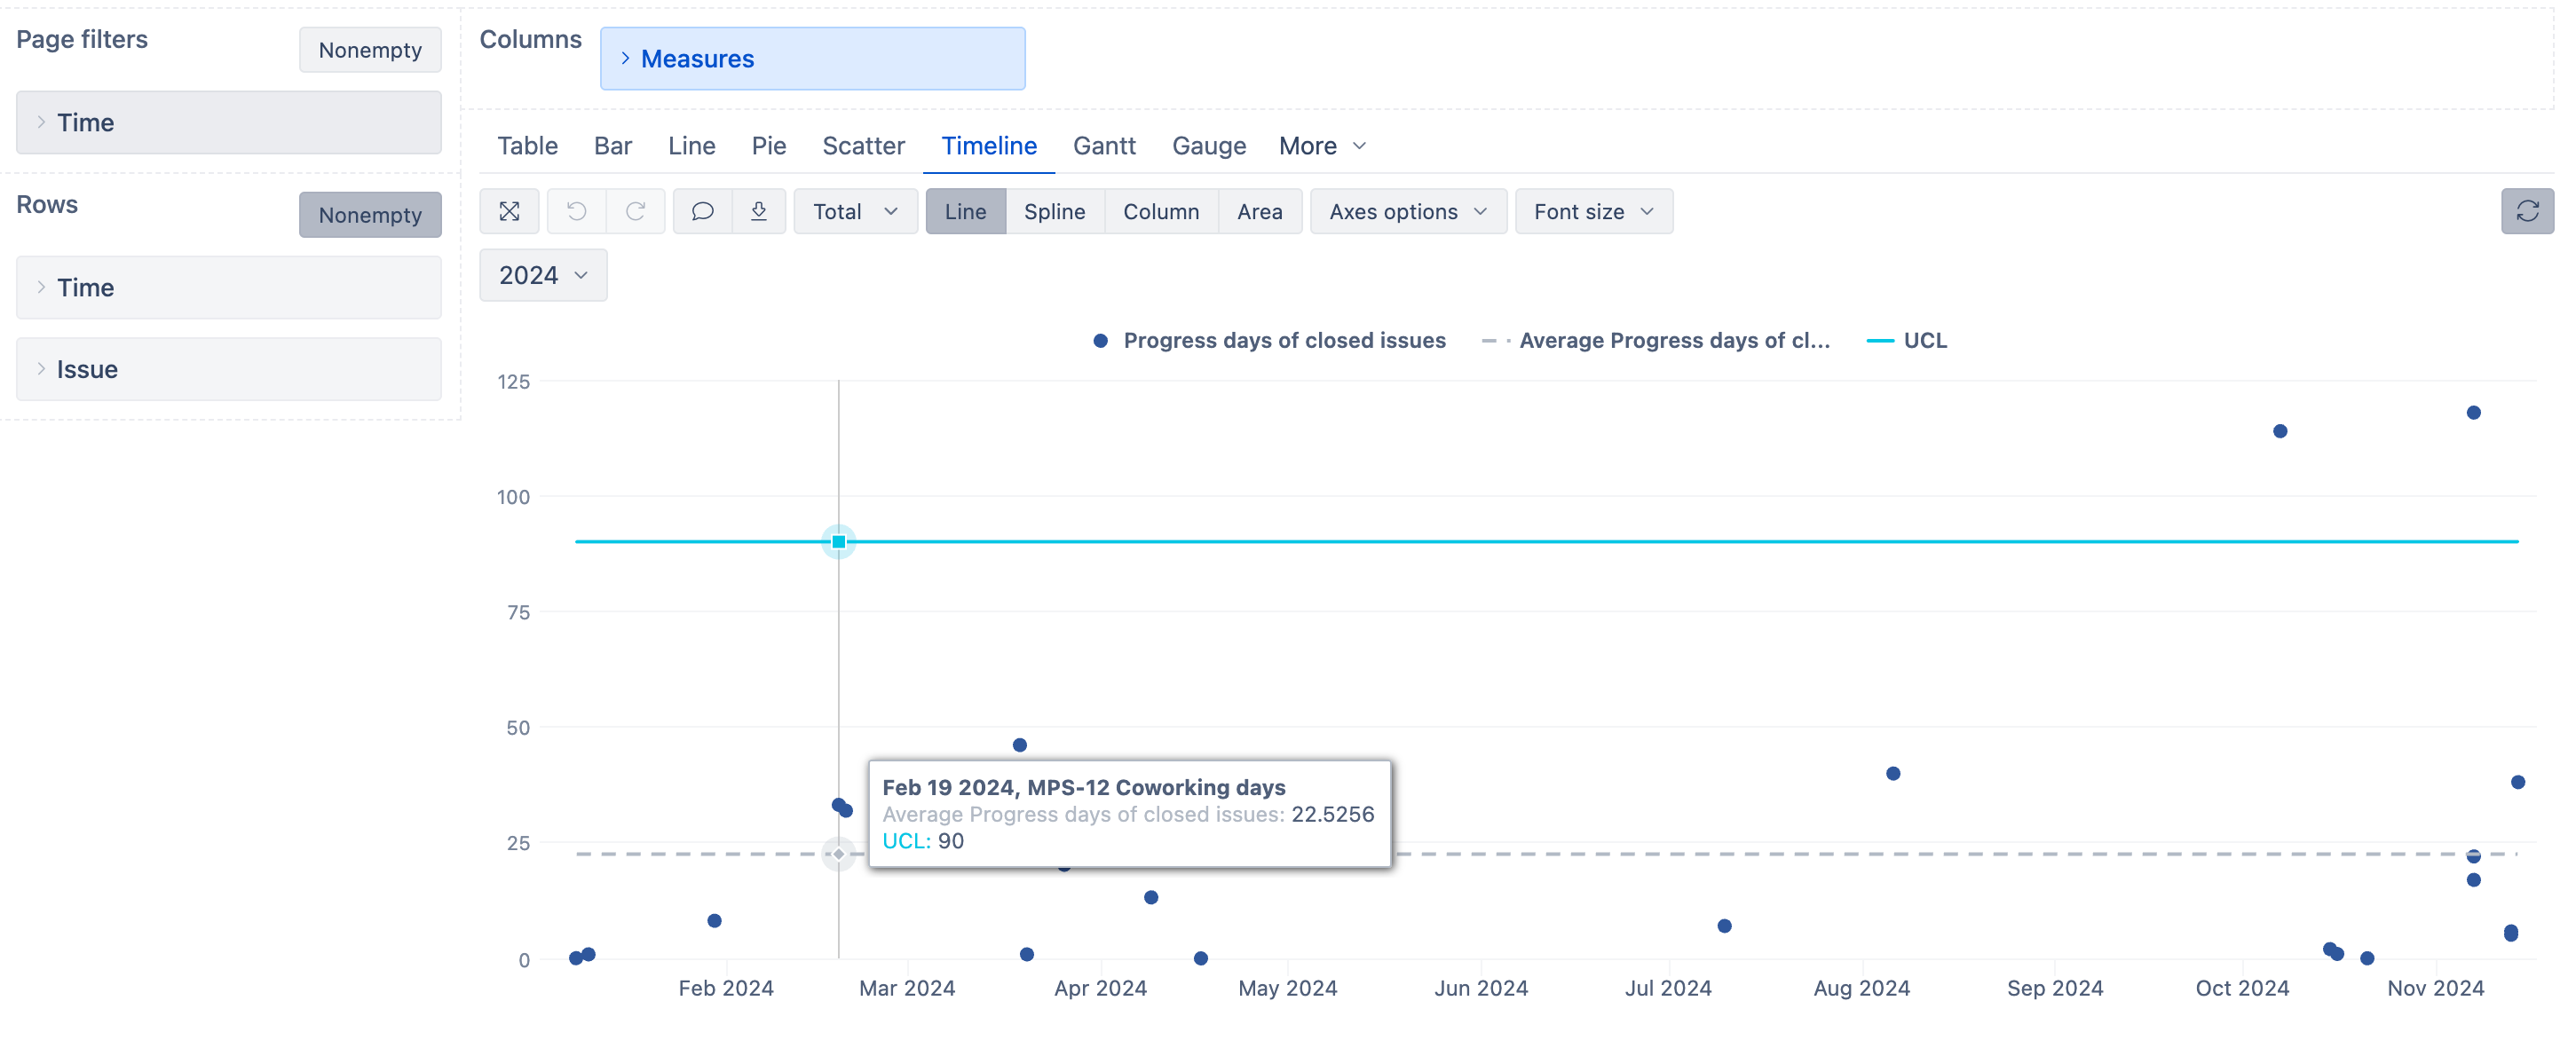
Hi @HRivest,
You can add Issues in the Rows & it will create one dot per issue as you can see below:
Best,
Marita from support@eazybi.com
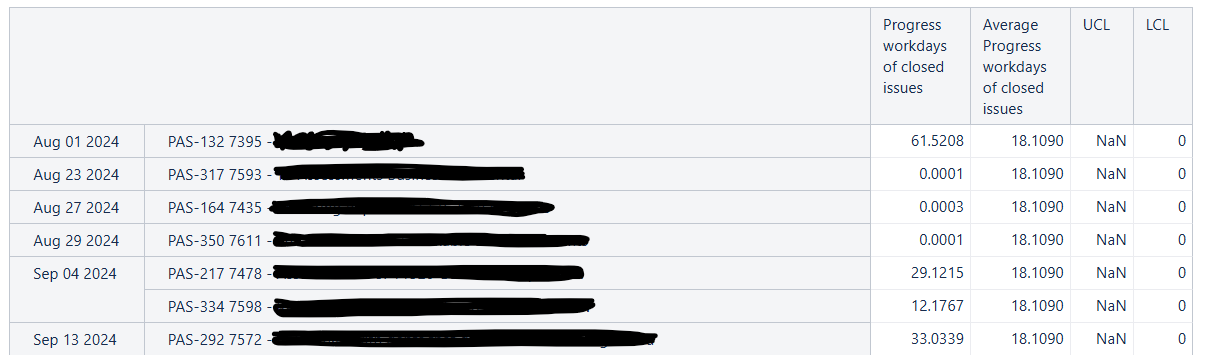
@Marita_Burgio If I do that my UCL and LCL disappear… I’m using the standard deviation MDX formula in the Control Chart (modified to be on a the Last 12 months period). How did you make it work?
Here is how my table looks like, I get a NaN error for UCL… The LCL is working simply because I have also modified the MDX to say that it can’t go lower than zero:
Hi @HRivest,
Could you please send your report definition to support@eazybi.com? Please add a reference to this community post in the email.
Thanks,
Marita // support@eazybi.com
Just did send the report definition to the eazyBI support email.