How can we configure the gantt chart in EazybI and give colour coding based on dates and not on %(Completion or resolved). Is there any way to customize our gantt chart or the configuration is limited?
Hi,
In the Gantt chart, colors are hardcoded, and you can’t change that.
The group of tasks is shown grey, while each particular task is shown blue while there is no information about the task progress. When you add the completion rate or progress, then the green color shows completed tasks, red - not completed overdue tasks. Those colors appear only when the completion rate is added.
More information in the documentation: https://docs.eazybi.com/eazybijira/analyze-and-visualize/create-charts#Createcharts-Ganttchart
More customizable is Bar chart with type range.
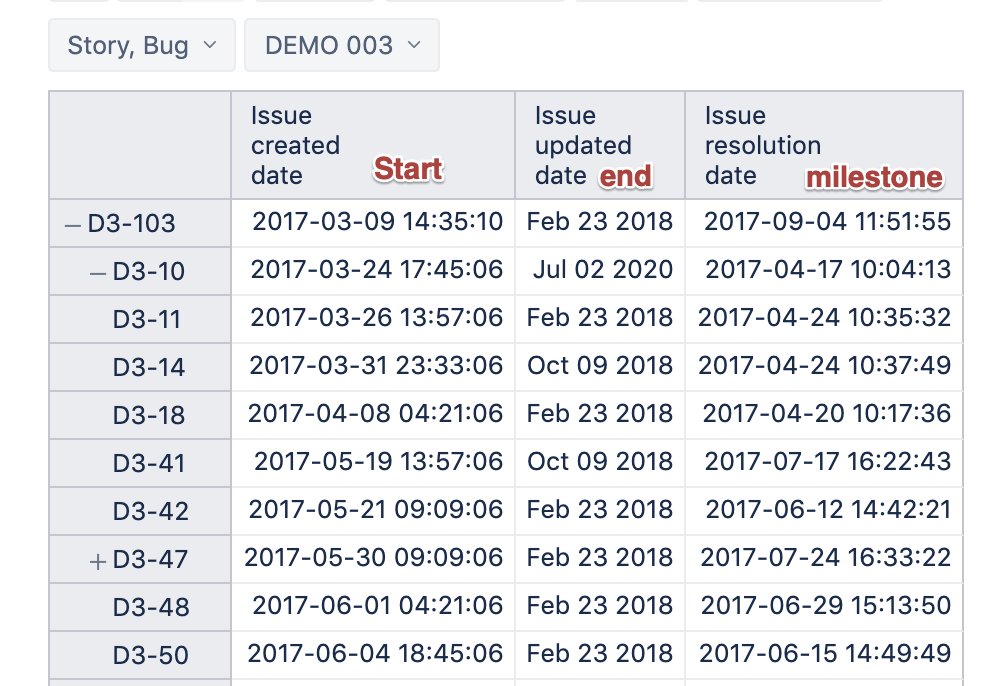
The report setup is the same: tasks in report rows and, similarly, as in the Gantt chart, start and end dates still have to be side by side in columns, and then other information, including milestones, would follow.
Switch to the Bar chart. To create a bar between the start and end dates, click on the start date and select the chart type range
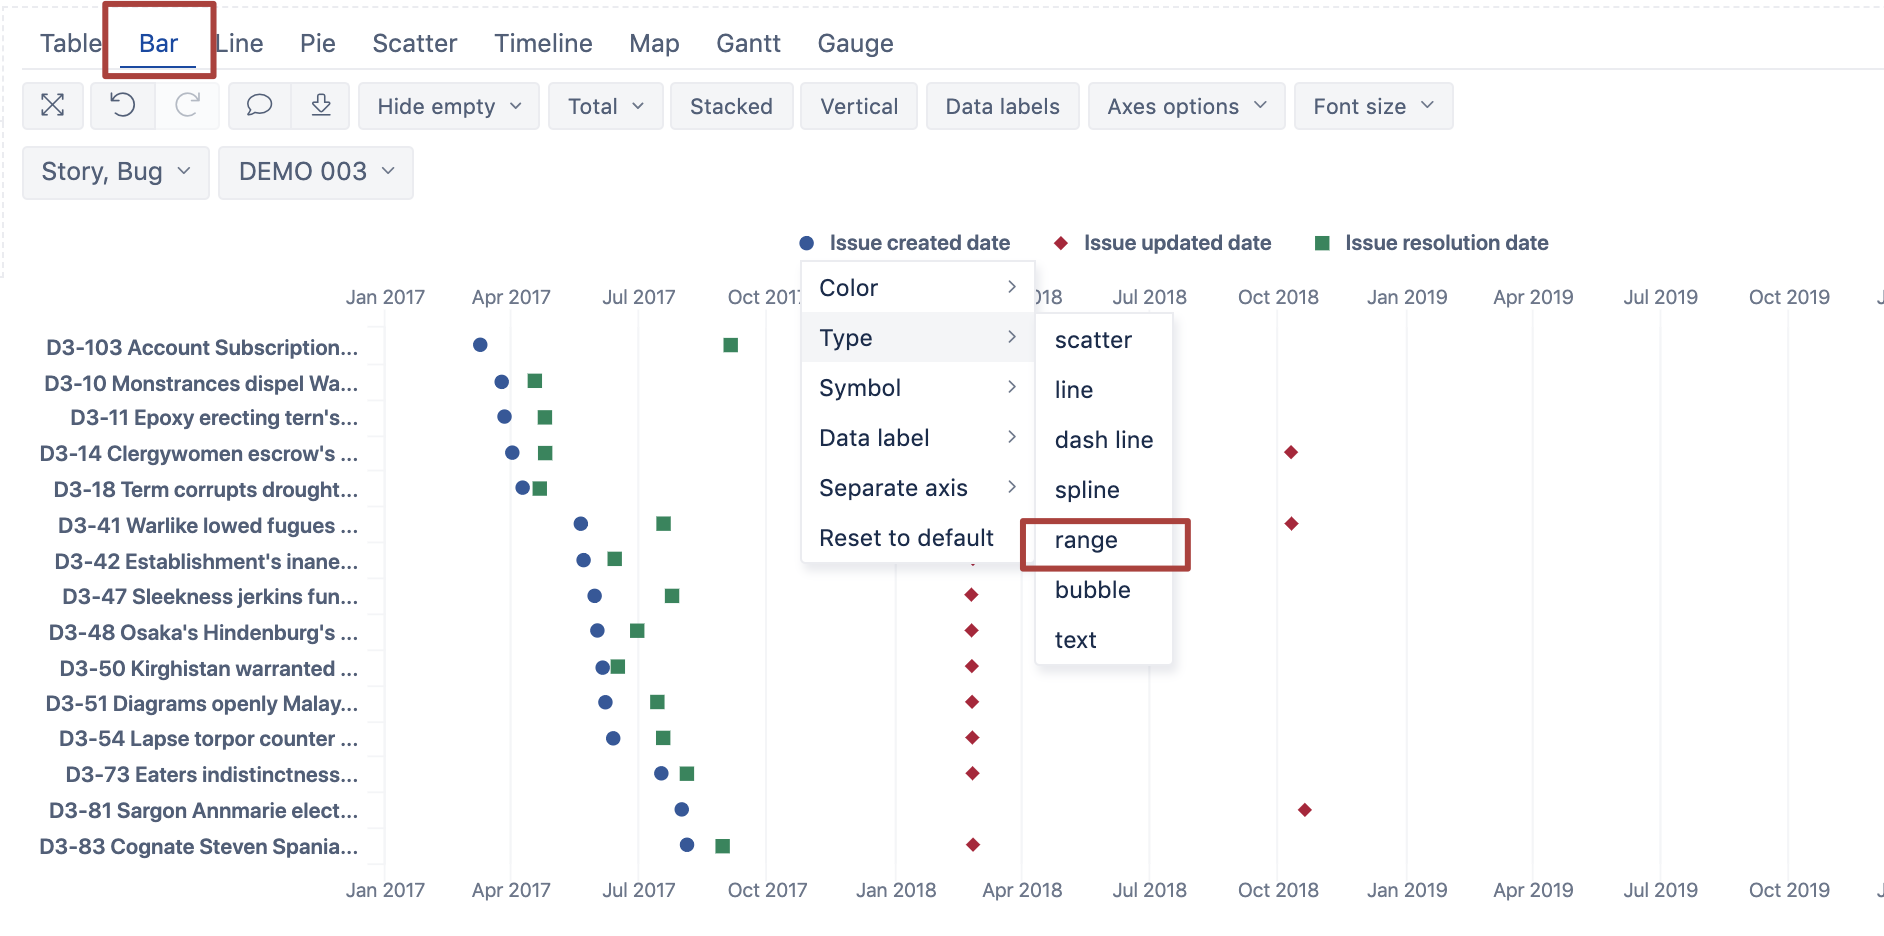
A range between this and the next measure is drawn.
Other added date properties - resolution date in our case - is shown as scatter points.

In the Bar chart, you may change colors as in any other bar chart and do other customization things.

There are a couple of demo reports where Bar chart with range is used instead of Gantt:
Best,
Hello,
this is a really cool feature. I created my Gantt chart in that way and I want to display now the sum of linked feature for a specific time period.
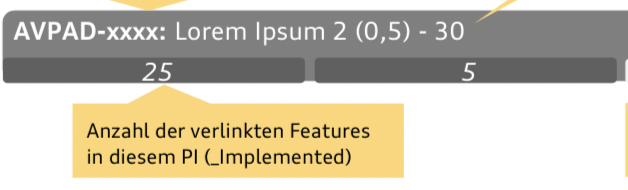
In this picture you can see a mock-up. I have already implemented the AVPAD bar with all the useful informations if I do a mouseover, but I want also the number of linked Feature in one specific quarter. The quarter is known via the fix Version (Example: fix Version PI21.1 = Q1, 2021).
can you help me?
Thanks a lot
Torben
Hi @ilze.leite
Is it possible to do this in the gantt report? put some icon within the estimated date of my epic