Hi Experts,
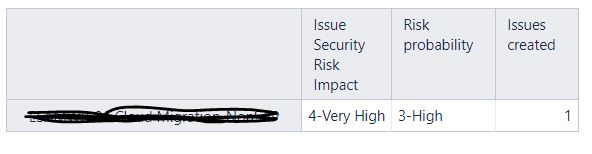
I am new with EazyBI and trying to do a scatter plot using below table. but impact and probability are not a number. How to convert it into 4 and 3?
Thanks!
Hi Experts,
I am new with EazyBI and trying to do a scatter plot using below table. but impact and probability are not a number. How to convert it into 4 and 3?
Thanks!
Hello @ADAMKEY ,
Check this (create a new measure):
CASE [Measures].[Issue Security Risk Impact].Value
WHEN "4-Very High" THEN 4
WHEN "3-High" THEN 3
-- .....
END
Left(  -- <String>, <Integer>
  [Measures].[Issue Security Risk Impact].Value,
  1
)
Hope it helps!
Kind regards,
Vasile S.
HI @ADAMKEY
Both solutions shared by @VasileS are great, use which one suits you the best. Thank you Vasile for being a great community member!
The only thing with the syntax - you do not need to use function Value in them, as it returns a numeric value, while you need to process strings in both calculations:
CASE [Measures].[Issue Security Risk Impact]
WHEN "4-Very High" THEN 4
WHEN "3-High" THEN 3
-- .....
END
and
Left(  -- <String>, <Integer>
  [Measures].[Issue Security Risk Impact],
  1
)
Best,
Ilze , support@eazybi.com
Thank you llze, I will try this solution as well!!
Thanks VasileS, It works!!
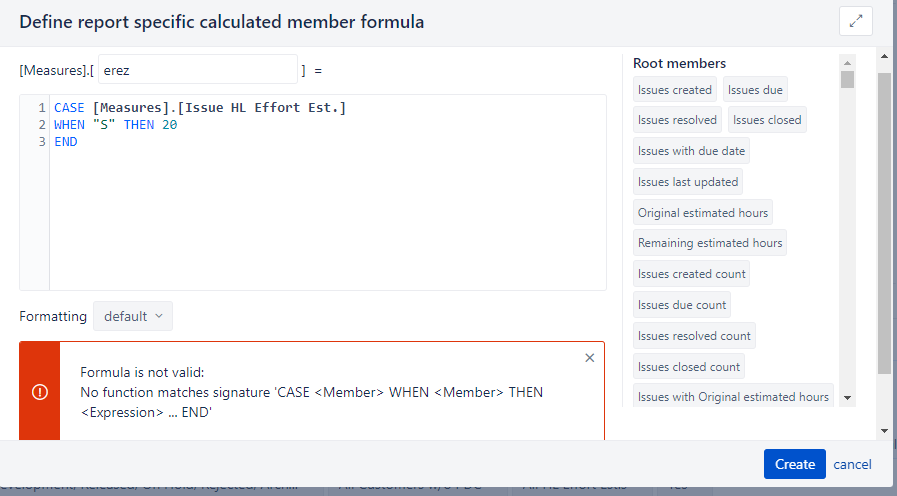
I get the same error.
Hi All!
Came across this thread and I’m encountering the same error.
Any thoughts on how to resolve it?
Hi @spamik206
This error is sometimes returned by the CASE statement when there are mismatching expressions used.
We have recently updated the CASE statement to tolerate more data combinations. If you are on Jira Data Center, please update eazyBI to the newest version and see if it fixes the issue.
Let me know if you need any additional assistance with this!
Best regards,
Nauris
Is there any workaround for case error without updating to latest version?