I have created a eazybi report if issues past 1 year.Here the data is very huge.These cannot be converted into bar graphs. It is saying that it cannot be converted as data is very huge.Can anyone give me a solution for this.How can i convert this table into bar graphs.
Hi @arru1516 ,
In eazyB charts, the data set limitation is 1000, please use a smaller data set to make the chart available - add dimensions in Pages or use a different hierarchy in your report.
E.g. use Year, Quarter or Month level from Time dimension:
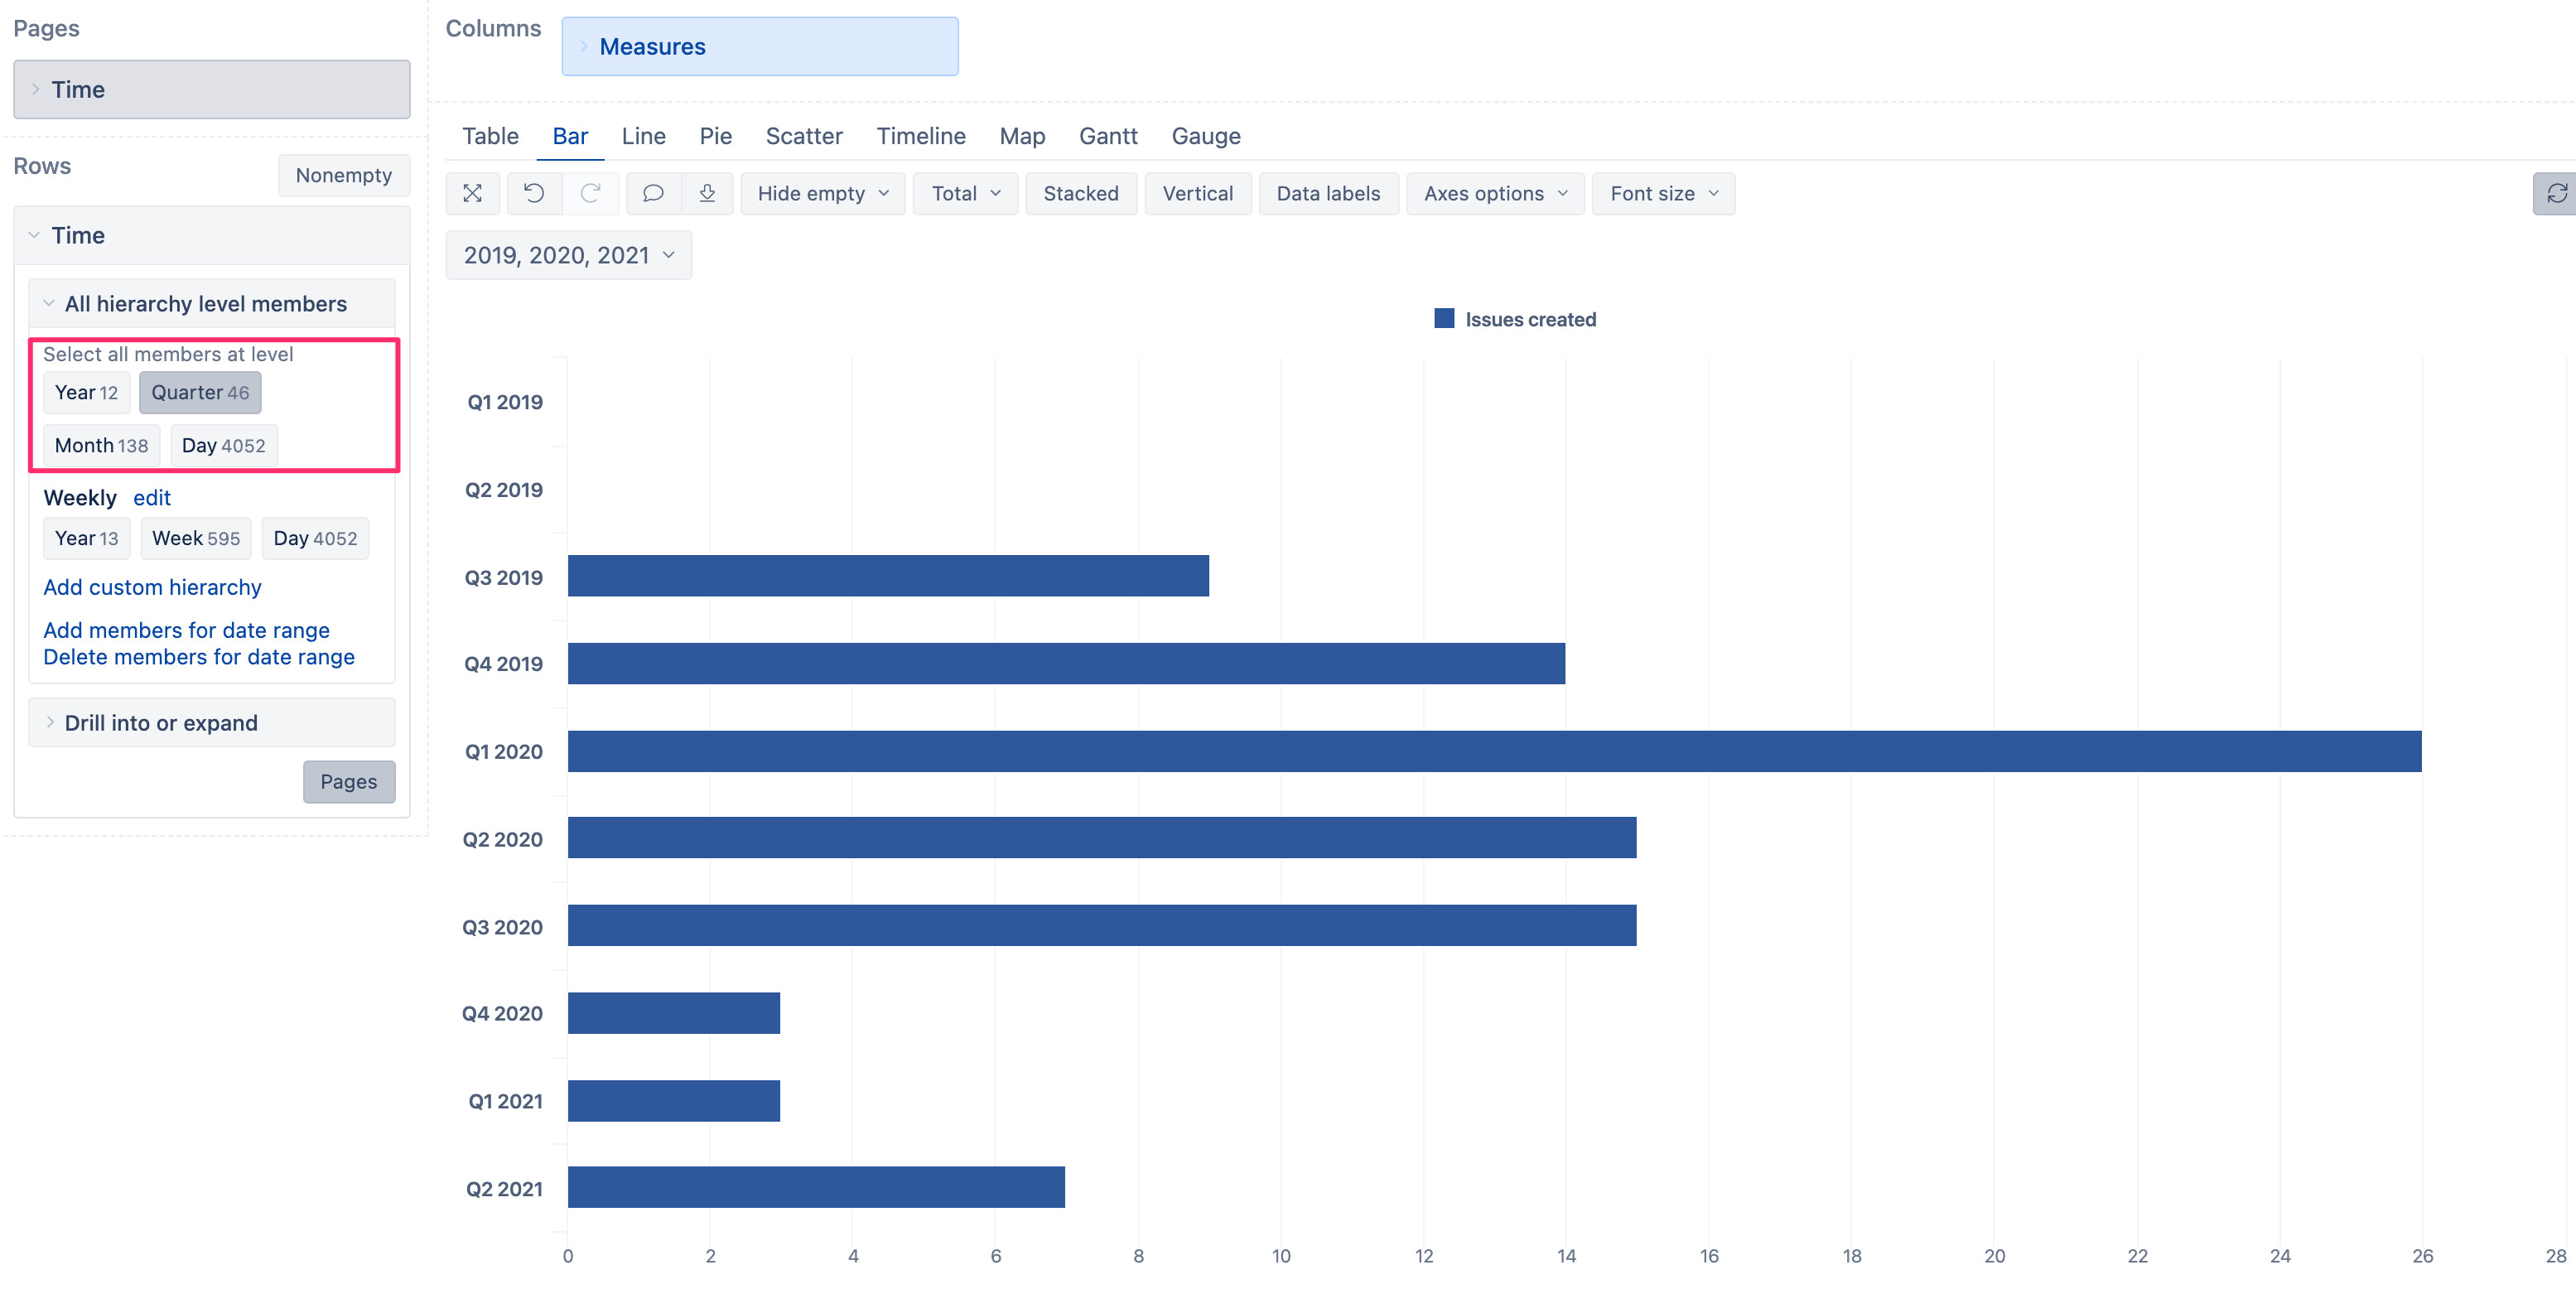
best,
Gerda // support@eazyBI.com