We have a nice report of all the Issues scheduled for production in a given week. It is ordered by requesting organization. The project manage would like a break row after each organization that has the total number of their tickets being put into production for the week. This is something that he has on a spreadsheet but we are having difficulty getting it on the eazyBI report. Examples would be wonderful. It has to go below the rows of Issues scheduled for production.
HI @RichWolverton,
My recommendation would be to create a dashboard and add separate reports per organization.
So essentially, you will create one report and have the “Organization” page filter set. Then save it for the organization. Then, you would create a copy of the report with the different organization in the filter. Finally add all the reports into a dashboard.
Eli Solutions
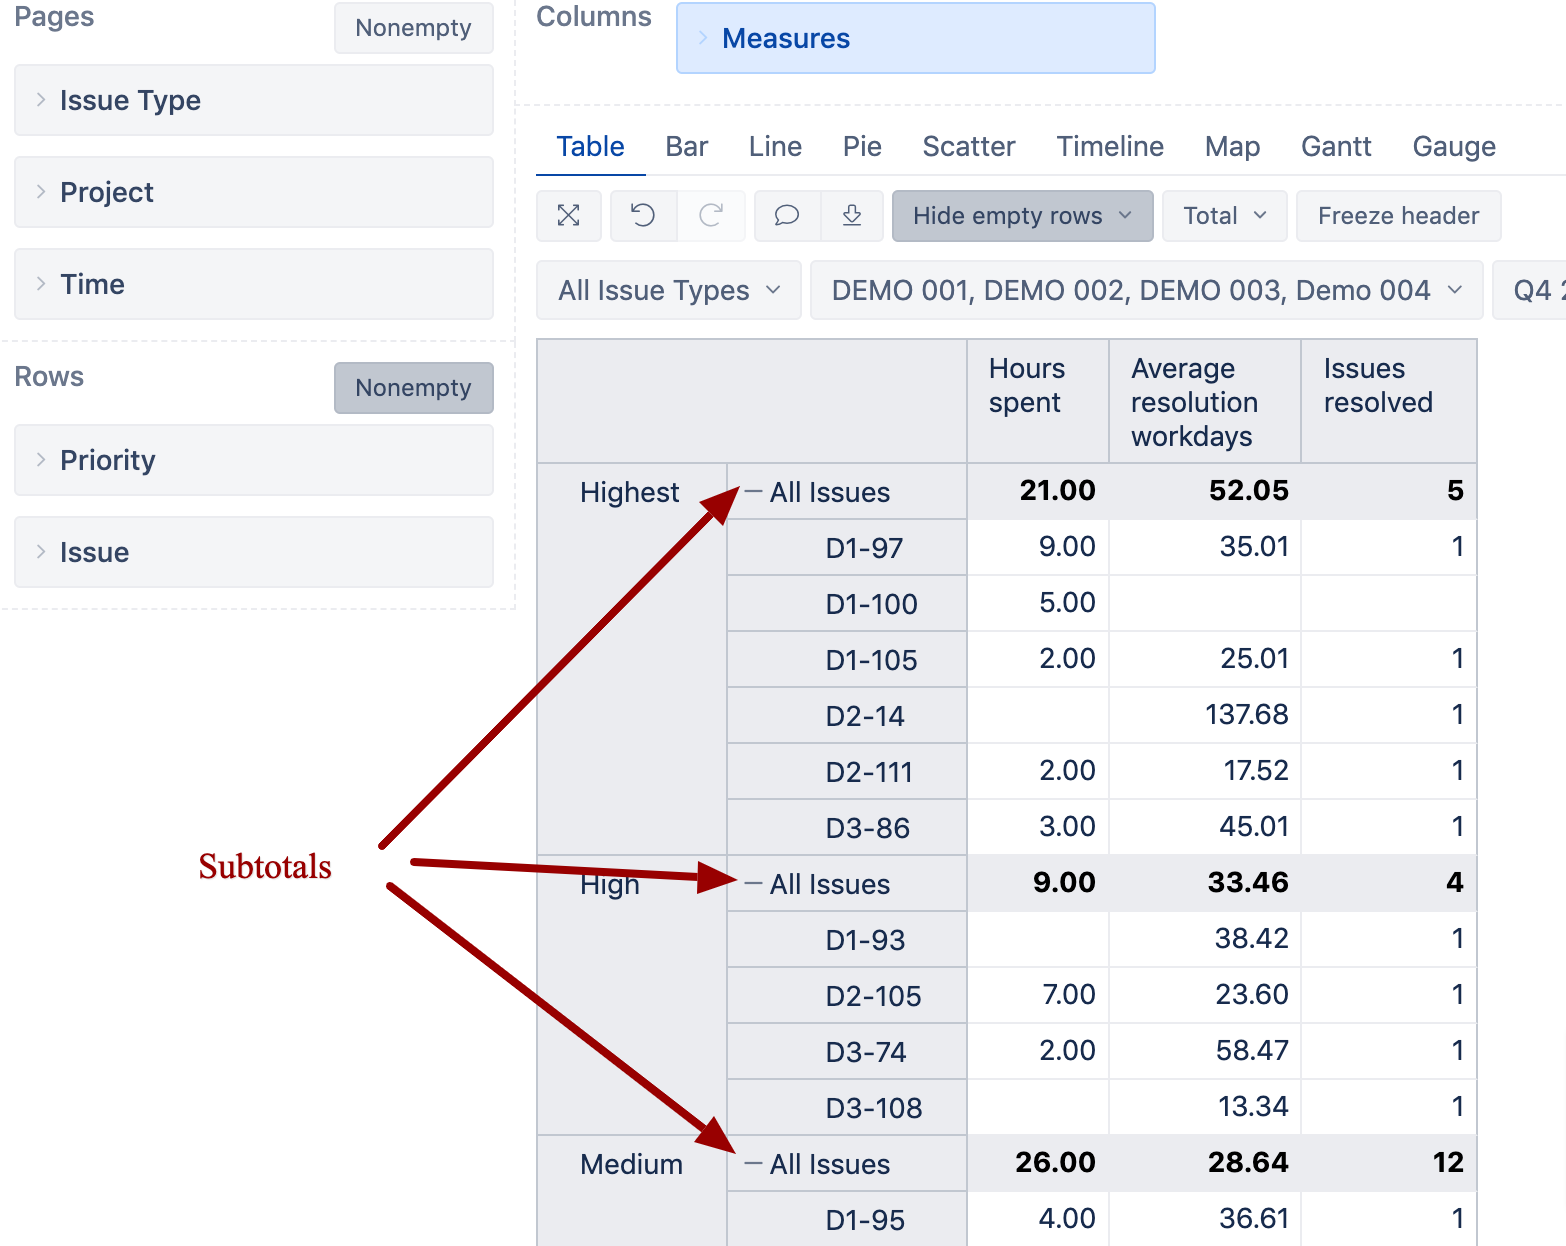
Indeed, sub-totals are shown on the higher level row, and, by default, it is above their children rows.
If you have issues from several projects, then use Issue dimension All Issues in rows, expand it to projects and then to issues, and then remove projects.
“All Issues” row would give the sub-total for each organisation. You may use conditional cell formatting to highligh All Issues rows (it is enough to highlight the first: Conditional cell formatting - eazyBI)
We also have a idea registered in ourfeatures backlog to consider sub-totals functionality in future. We will keep you updated when something new appears regarding that.
Other options are related to restructurisation the report:
- move Organization dimension in Pages and then retrieve the report by each selected organization and use Total row to get the count of issues - as @eli_solutions already suggested
- create a report with Organizations in rows (without issues) with the same measures and use it in the dashboard side by side with the issue list to see the totals by organizations.
Best,
Ilze, support@eazybi.com