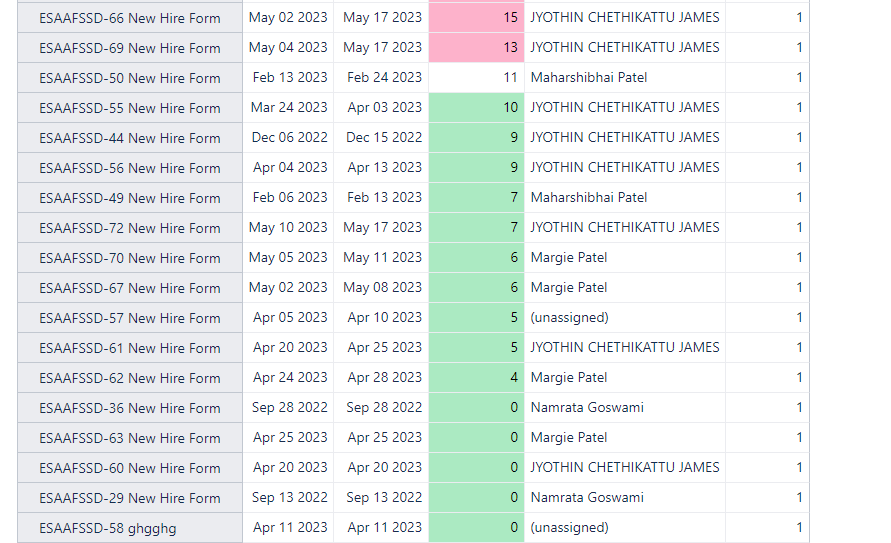
I’m trying to create a a report where I’m able to count how many row with each value, for example I want to know how many (0) and how many (4) and so on, attached is a screenshot form the report itself.
Hi @Tamer ,
I recommend importing the numeric metric as a dimension and using it in the report rows to satisfy your requirement.
If the metric is a Jira custom field, you can enable it for import as a dimension with custom field import options - Custom field import options or via the eazyBI advanced settings for custom fields - Advanced settings for custom fields.
After importing the field as a dimension, select it in the report rows, and together with the measure “Issues created”, you will see the number of issues for each value.
If it is a calculated value, you have to look in the direction of new calculated fields - New calculated fields or JavaScript calculated custom fields - JavaScript calculated custom fields to calculate the value with JavaScript and import it as a dimension.
Best,
Roberts // support@eazybi.com
