Dear Team,
I am trying to visualize on x axis the no. of stories & on y axis the Epic.
Figure 7 in the below link is what I am trying to achive with JIRA & eazy BI.
https://www.scaledagileframework.com/metrics/
Is it possible?
Details:
Feature Progress Report The feature progress report tracks the status of features and enablers during PI execution. It indicates which features are on track or behind at any point in time. The chart has two bars: Plan – Represents the total number of stories planned. Actual – Represents the number of stories completed. The bar is shaded red or green, depending on whether or not the item is on track.
© Scaled Agile, Inc.
Include this copyright notice with the copied content.
Read the FAQs on how to use SAFe content and trademarks here:
https://www.scaledagile.com/about/about-us/permissions-faq/
Explore Training at:
https://www.scaledagile.com/training/calendar/
The Gantt view goes someway to replicating it.
Hi @Bhavini_Vazirani!
@Guy_Winterbotham, thank you for the suggestion!
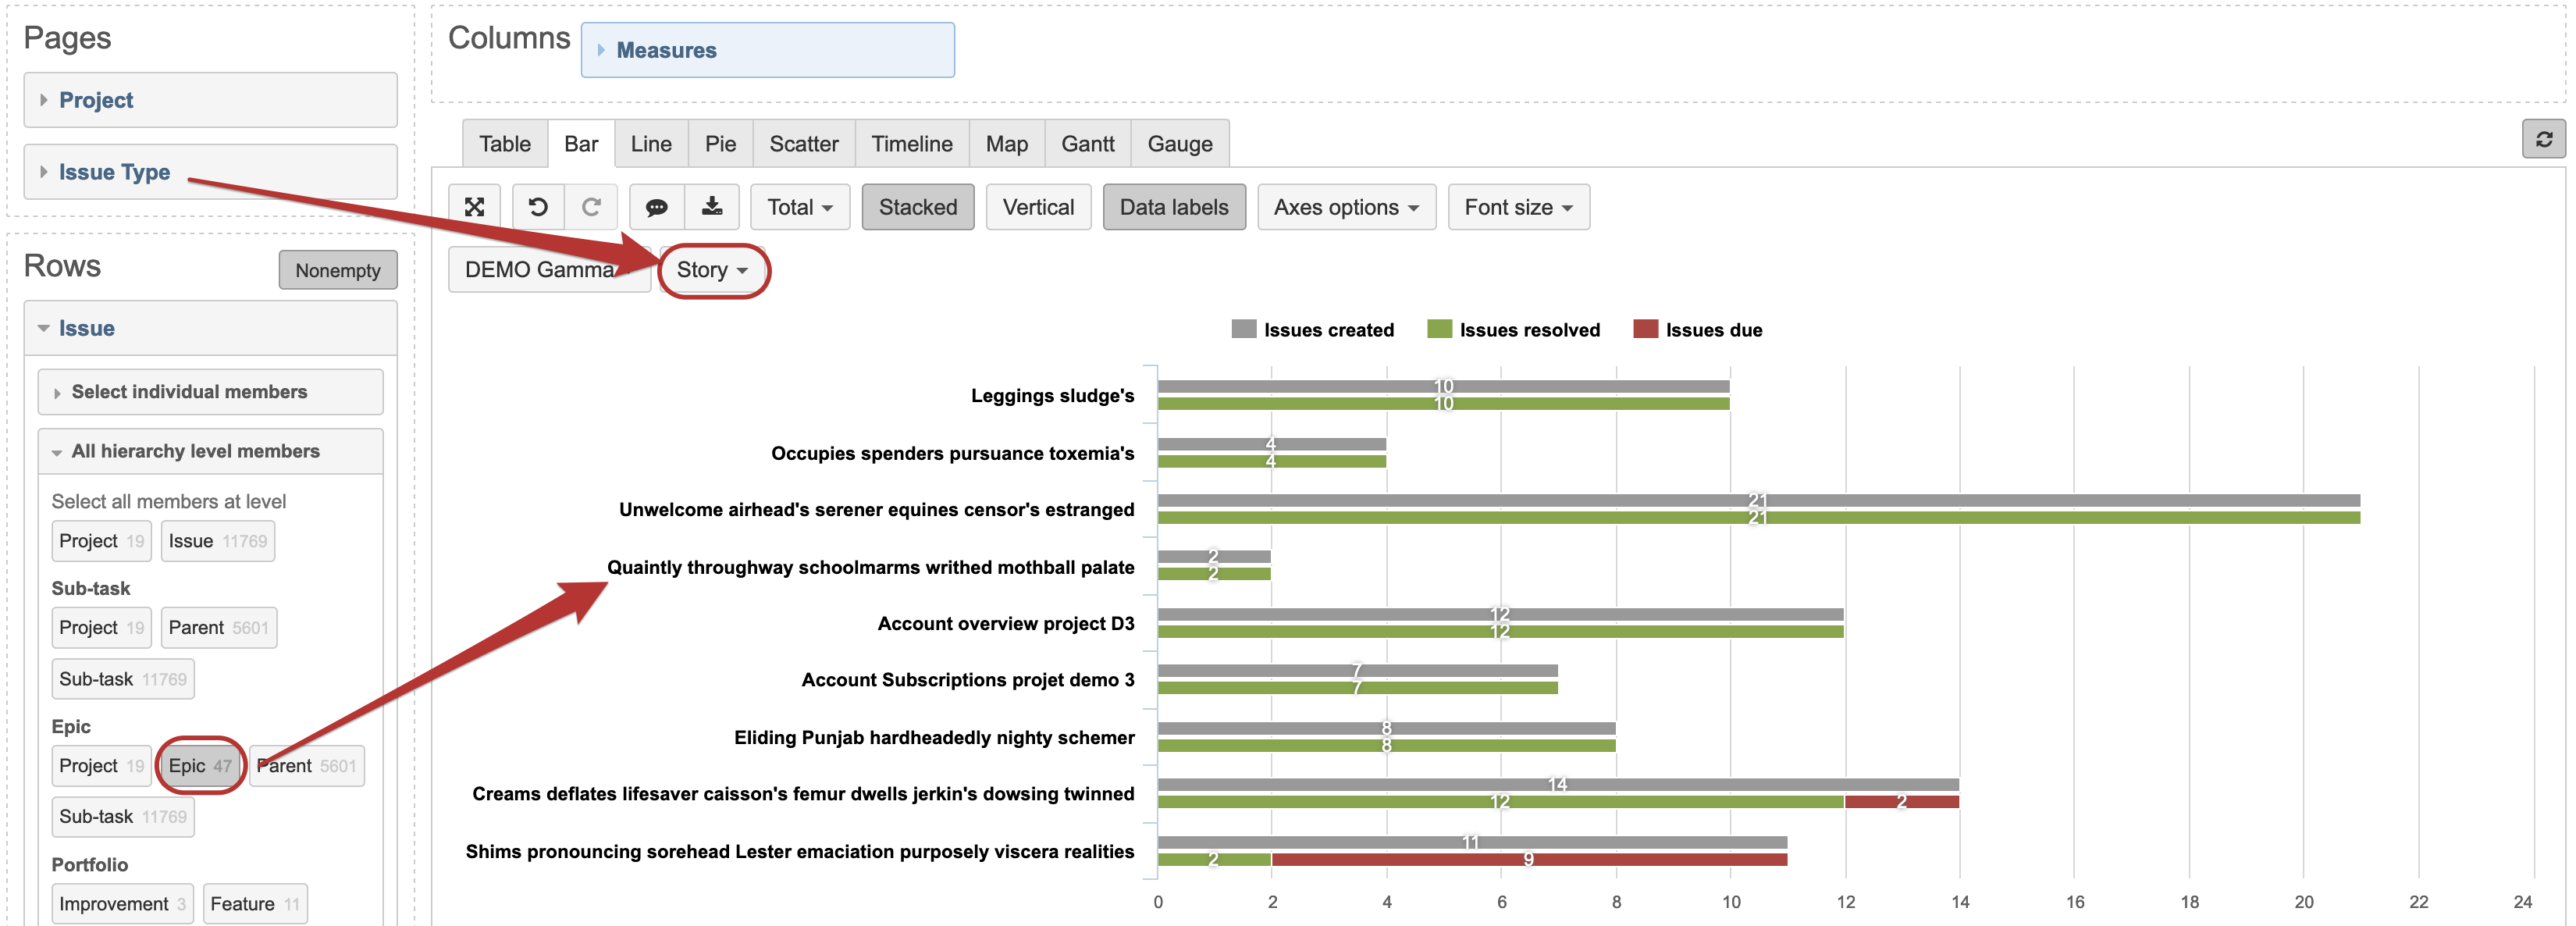
Additionally, one easy way of creating such a report in eazyBI would be by using the Issue dimension / Epic level. Together with standard Issues created (total number of issues in Epic), Issues resolved and Issues due measures it would show the progress of Epic. If you are only interested in Stories, you can add Issue Type filter in Pages.
Lauma / support@eazybi.com
1 Like
Looks good. Thank you. I tried it just now. Works as expected.
1 Like
Dear Ms. Circule,
Unfortunately, today I tried to verify the data. I found at least one Epic which is not showing the correct status. There are 4 issues in Epic section and EazyBI shows only Issues created as 2.
In another report, the new Epics with issues in Epic are not showing up in this chart.
Could there be any reason for this inconsistency? I have checked the data import timings, they seem to be fine.
Regards,
Bhavini
Hi!
Not all Projects are imported in eazyBI, only the selected ones. So it could be that some of the issues are coming from a project that is not being imported. Could you check if this is so?
If you still find some inconsistencies, please send screenshots from Jira and eazyBI to support@eazybi.com.
Lauma / support@eazybi.com
Hi, a really basic question for when creating this chart, how do I create the 2 rows, ie issues created, then the stacked row, resolved & due?
Thanks Elizabeth
Hi @elizabeth.senior!
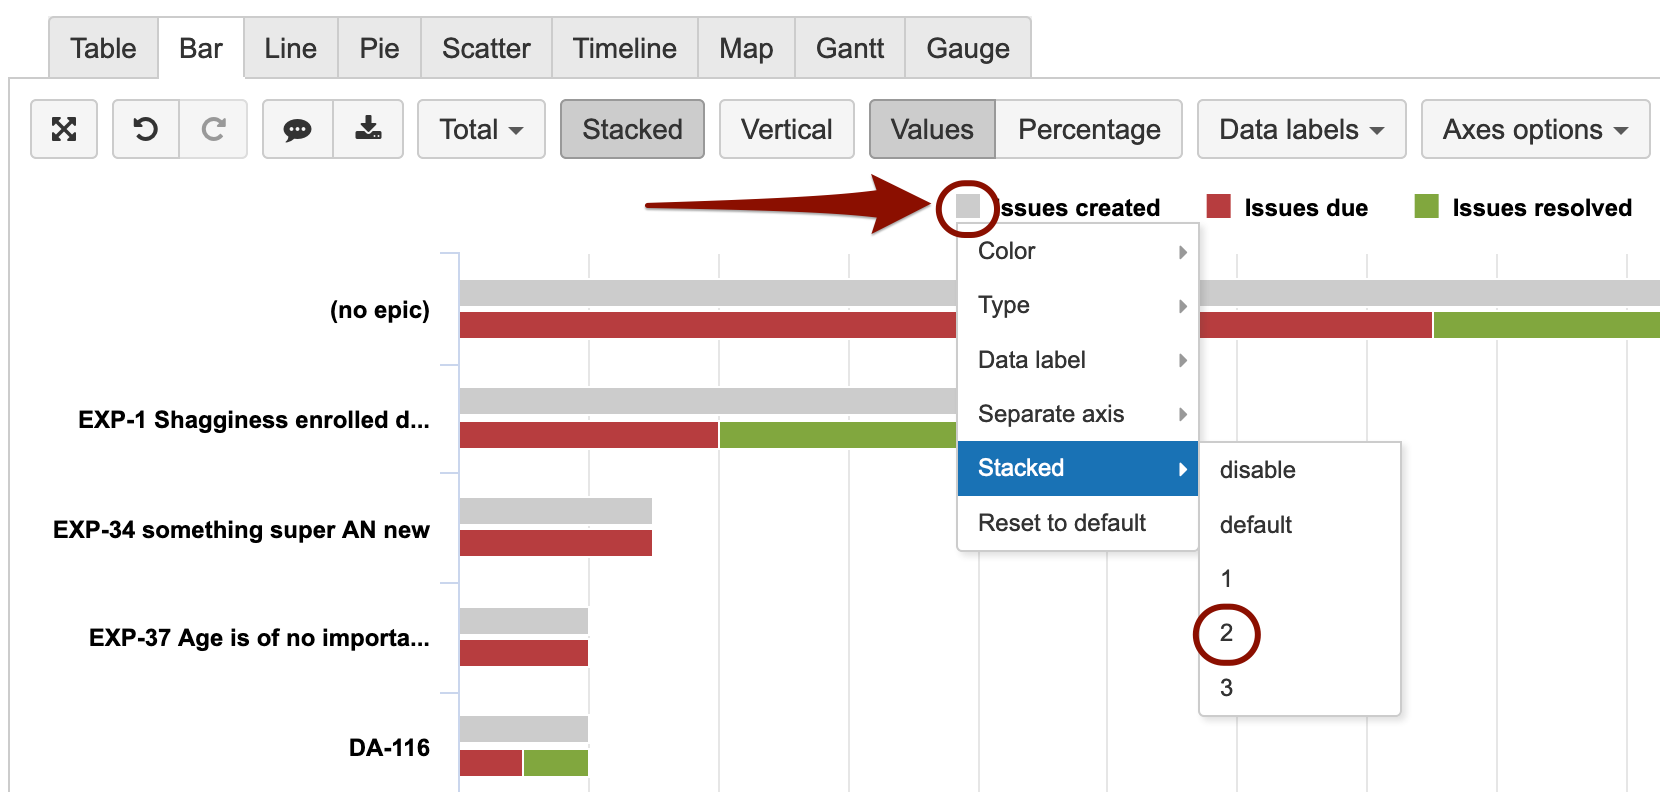
When clicking on the data marker in front of the measure name there are many customization options, see more details here https://docs.eazybi.com/eazybijira/analyze-and-visualize/create-charts#Createcharts-Customizechart.
In the case of using a Stacked bar chart, you can choose to have several stacks. In this case, the Issues created is brought out in stack 2.
Lauma / support@eazybi.com
Great, thank you for sending this through!
1 Like