When clicking on the data marker in front of the measure name there are many customization options, see more details here https://docs.eazybi.com/eazybijira/analyze-and-visualize/create-charts#Createcharts-Customizechart.
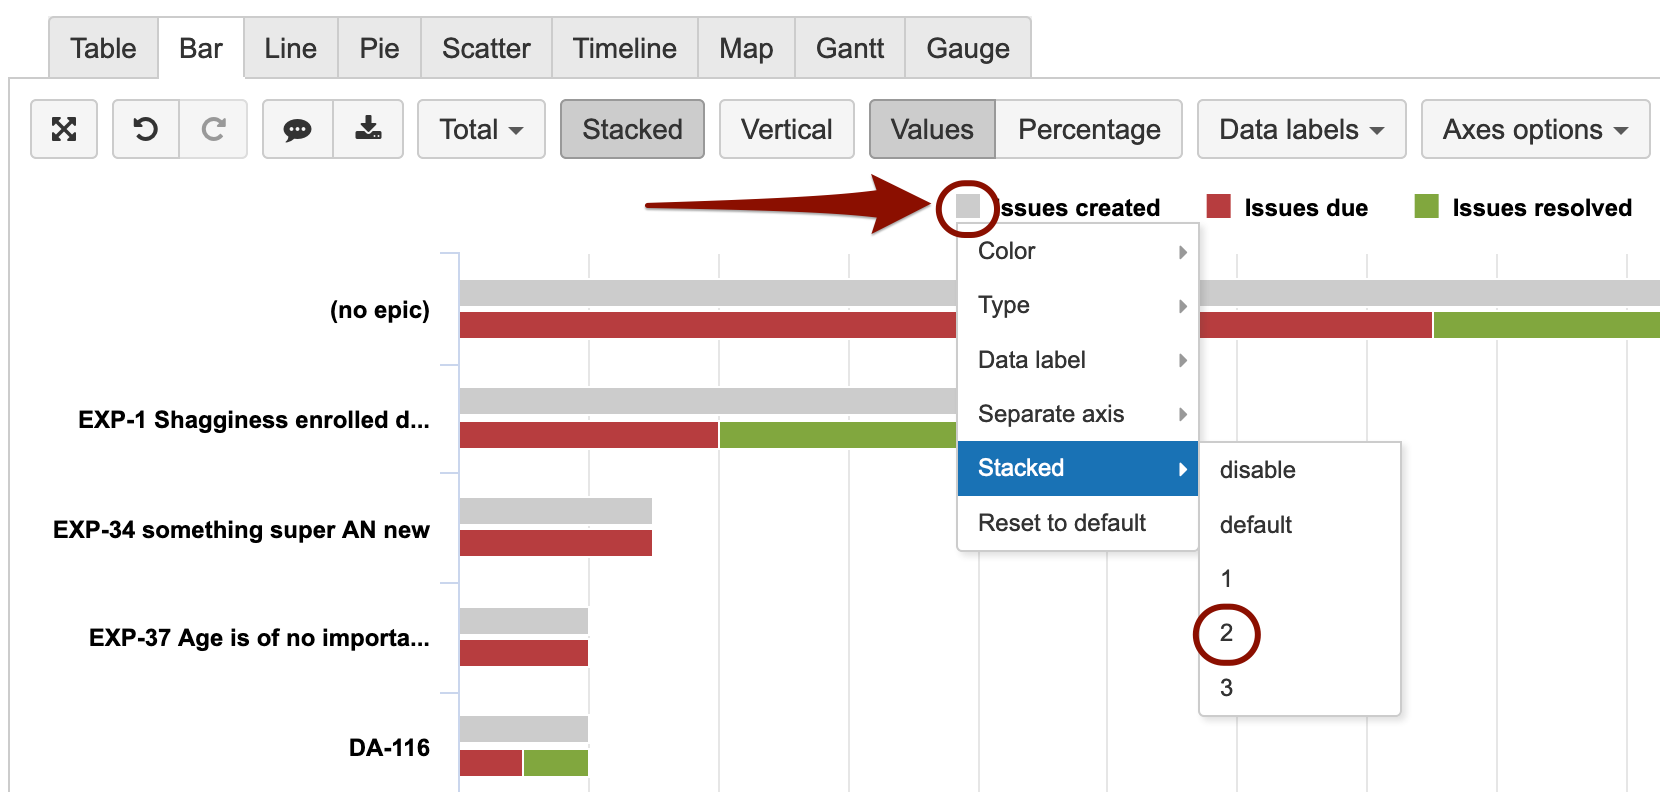
In the case of using a Stacked bar chart, you can choose to have several stacks. In this case, the Issues created is brought out in stack 2.
Lauma / support@eazybi.com