Hello developers,
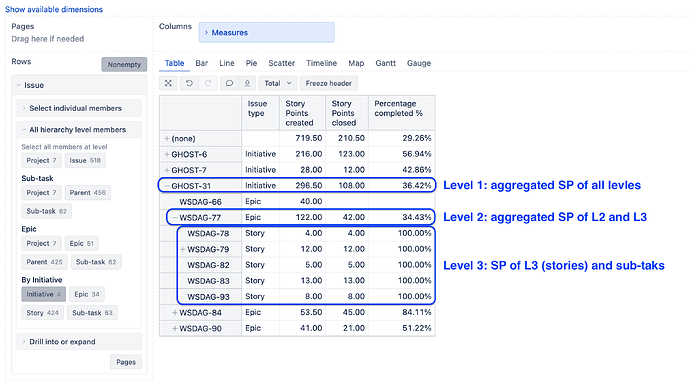
I am new to EazyBI and I have a request to create a graph which gives “Total story points” and “closed story points %” for all the features
My Project Hierarchy is:
Level 1 —> FEATURE1, FEATURE2, FEATURE3
Level 2 —> EPIC1, EPIC2, EPIC3 etc
Level 3 —> STORY1, STORY2, STORY3 etc
FEATURE’s will have one-to-many EPIC1, EPIC2, EPIC3 etc and then
EPIC’s will have one-to-many STORY1, STORY2, STORY3 etc
___________________________________________________________________________
The story points are allocated to STORY1, STORY2, STORY3 etc
“Total Story Points” and “Closed Story Points” should be calculated basis on status of STORY1, STORY2, STORY3
FEATURE1
STORY1 - 2 Story Points
STORY2- 3 Story Points & status=closed
STORY3- 3 Story Points
So, “Total Story Points” = 8 & “Closed Story Points” = 3 & “Percentage completed”= 38% for FEATURE1
Also, I would like to have a structure in EazyBI like:
FEATURE1
→ EPIC 1, EPIC 2 etc
—>STORY1
—> STORY2
—> STORY3
Please help me on how to generate this report.
